Fig. 29.
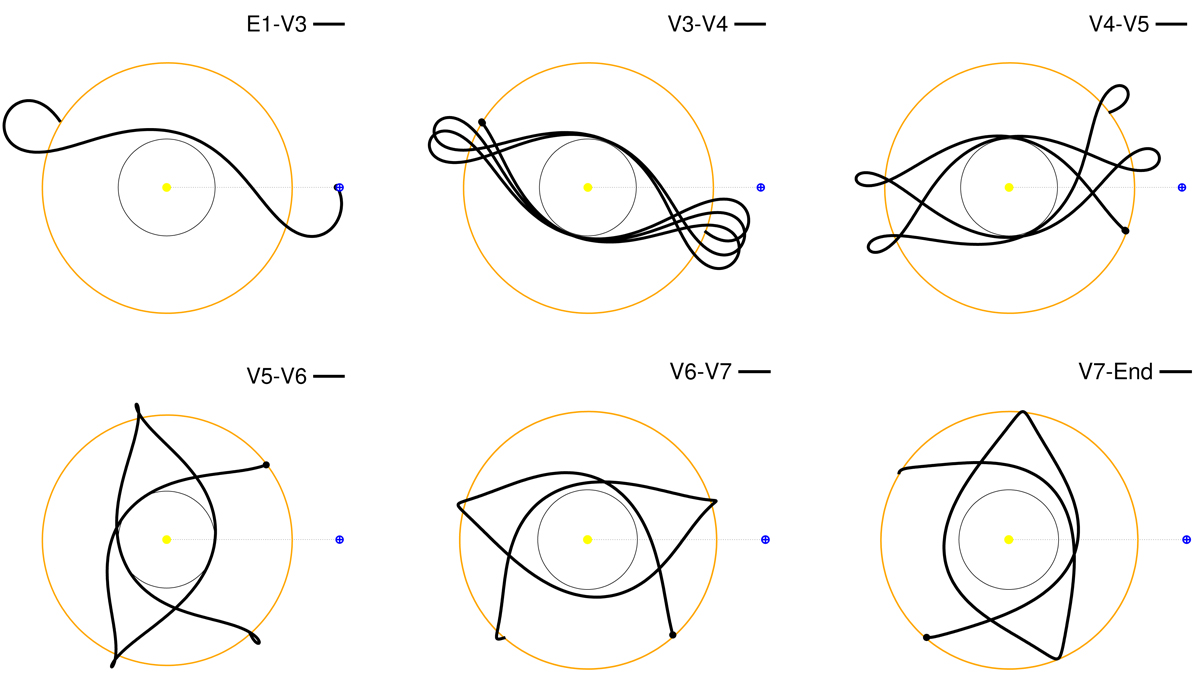
Science orbits during the different parts of the nominal and extended mission phases, plotted in the Sun–Earth co-rotating frame (black lines). The Sun is at the centre of each plot (yellow dot), Earth (blue dot) is at centre-right. Venus’ orbit is shown in orange. The data downlink increases quadratically with decreasing distance to Earth, which is why the V3–V4 and V4–V5 parts of the trajectory are ideal to downlink large data volumes.
Current usage metrics show cumulative count of Article Views (full-text article views including HTML views, PDF and ePub downloads, according to the available data) and Abstracts Views on Vision4Press platform.
Data correspond to usage on the plateform after 2015. The current usage metrics is available 48-96 hours after online publication and is updated daily on week days.
Initial download of the metrics may take a while.