Fig. 1.
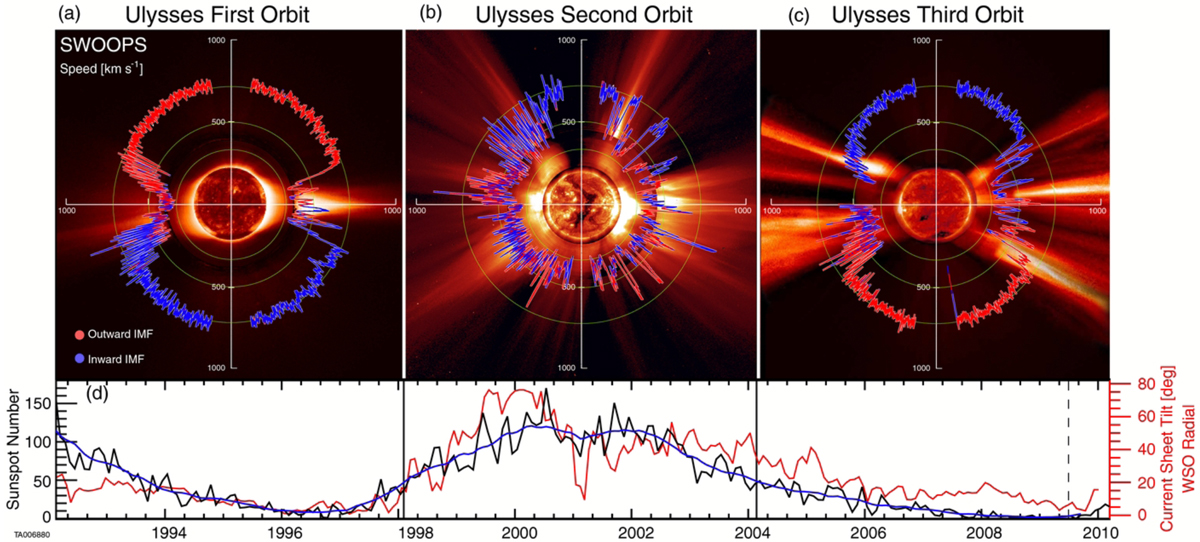
Graphic from McComas et al. (2013) showing polar plots of the solar wind speed as measured by the Ulysses mission. The interplanetary magnetic field is color coded: outward (red) and inward (blue). For each polar plot, time progresses counterclockwise from the nine o’clock position. Matching time ranges in the bottom panel d are indicated by the vertical lines; this panel provides the sunspot number (black, see Clette & Lefèvre 2016 for the recalibrated sunspot number), smoothed sunspot number (blue), and Wilcox Solar Observatory (WSO) calculated heliospheric current sheet tilt angle (red). As visual indicators of the general solar and coronal structure for these three orbits, the figure displays images taken on 1996 August 17, 2000 December 7, and 2006 March 28, respectively, combining (from the inside out) images from SOHO’s Extreme ultraviolet Imaging Telescope (Fe XII at 19.5 nm), the Mauna Loa K coronameter (700–950 nm), and SOHO’s LASCO C2 white light coronagraph. (Reproduced with permission from the AAS).
Current usage metrics show cumulative count of Article Views (full-text article views including HTML views, PDF and ePub downloads, according to the available data) and Abstracts Views on Vision4Press platform.
Data correspond to usage on the plateform after 2015. The current usage metrics is available 48-96 hours after online publication and is updated daily on week days.
Initial download of the metrics may take a while.