Fig. 5
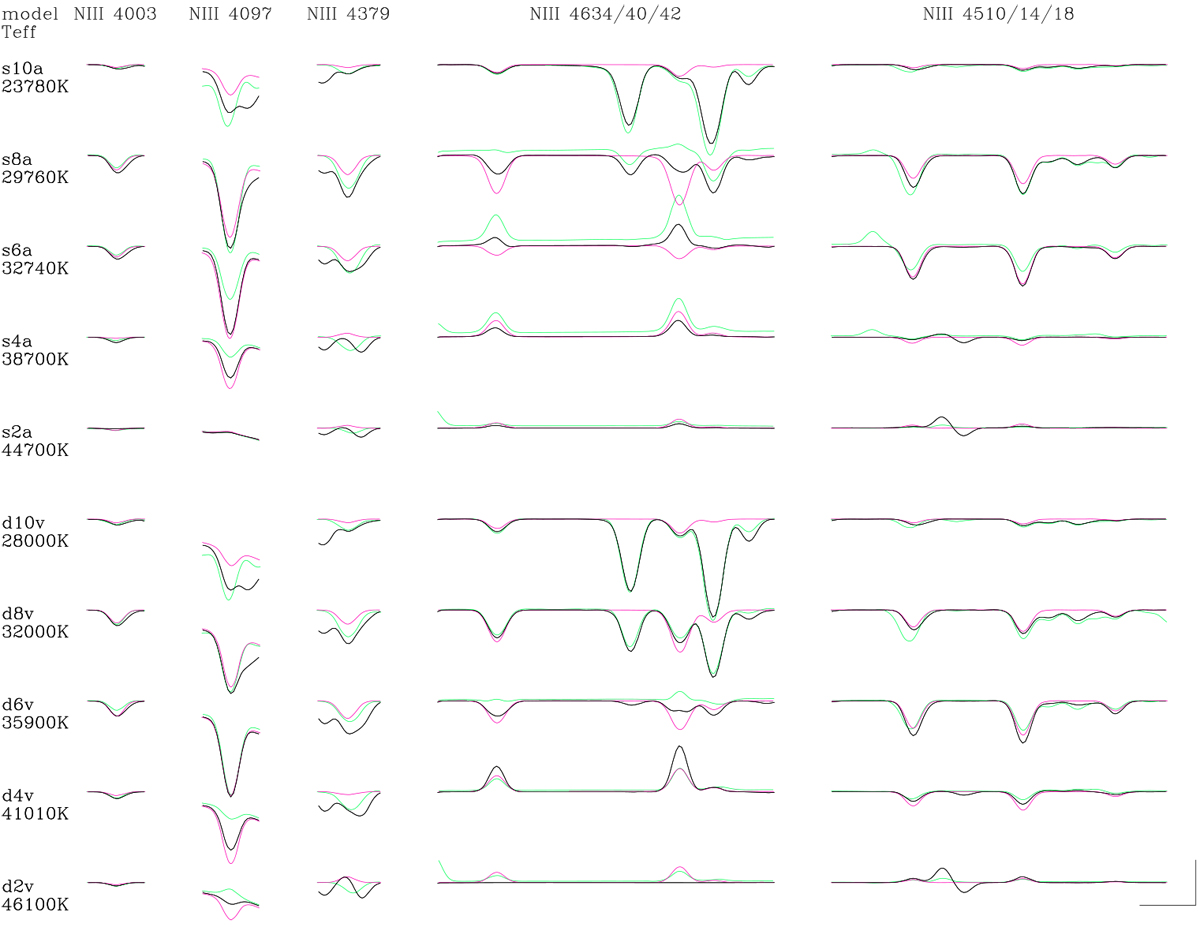
As Fig. 4, but for strategic N III lines. Here, the marker indicates a wavelength range of 2 Å, and 0.2 of the continuum. The positions of the individual components of N III λλ4634−4640−4642 of the cooler objects can be clearly seen in the red FASTWIND v10 profiles. Since most lines are weak, no rotational broadening has been applied.
Current usage metrics show cumulative count of Article Views (full-text article views including HTML views, PDF and ePub downloads, according to the available data) and Abstracts Views on Vision4Press platform.
Data correspond to usage on the plateform after 2015. The current usage metrics is available 48-96 hours after online publication and is updated daily on week days.
Initial download of the metrics may take a while.