Fig. 2
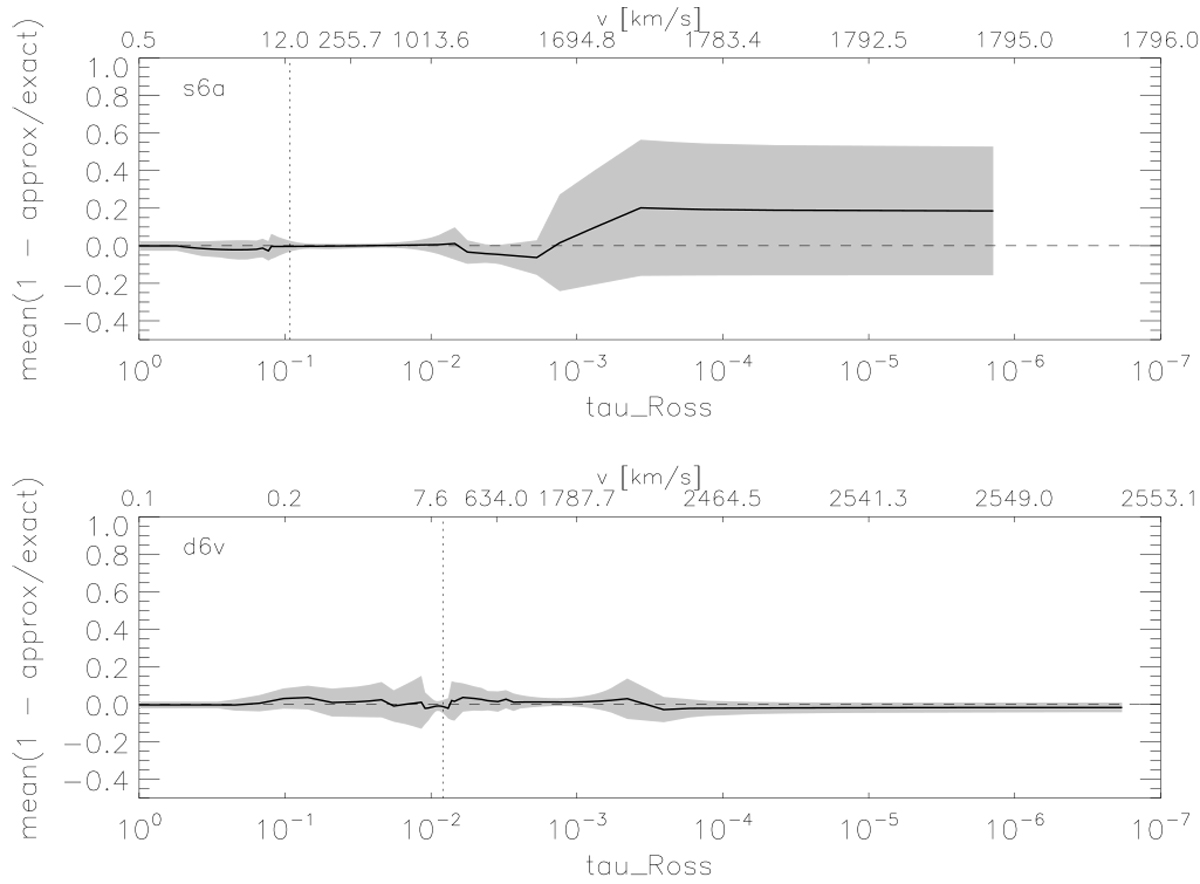
Mean (relative) differences between the main ionization fractions as predicted by our approximate NLTE description following Puls et al. (2005), and our current “exact solution” (complete NLTE, detailed CMF transport), as a function of τRoss ≤ 1 and v (in km s −1). Displayed are the models with the largest differences (s6a) and the smallest ones (d6v) within our grid. The mean (see Eqs. (6) and (7)) refers to 11 selected elements from C to Ni, and its 1-σ deviation is displayed in gray. The vertical lines indicate the location of the sonic point.
Current usage metrics show cumulative count of Article Views (full-text article views including HTML views, PDF and ePub downloads, according to the available data) and Abstracts Views on Vision4Press platform.
Data correspond to usage on the plateform after 2015. The current usage metrics is available 48-96 hours after online publication and is updated daily on week days.
Initial download of the metrics may take a while.