Fig. B.1
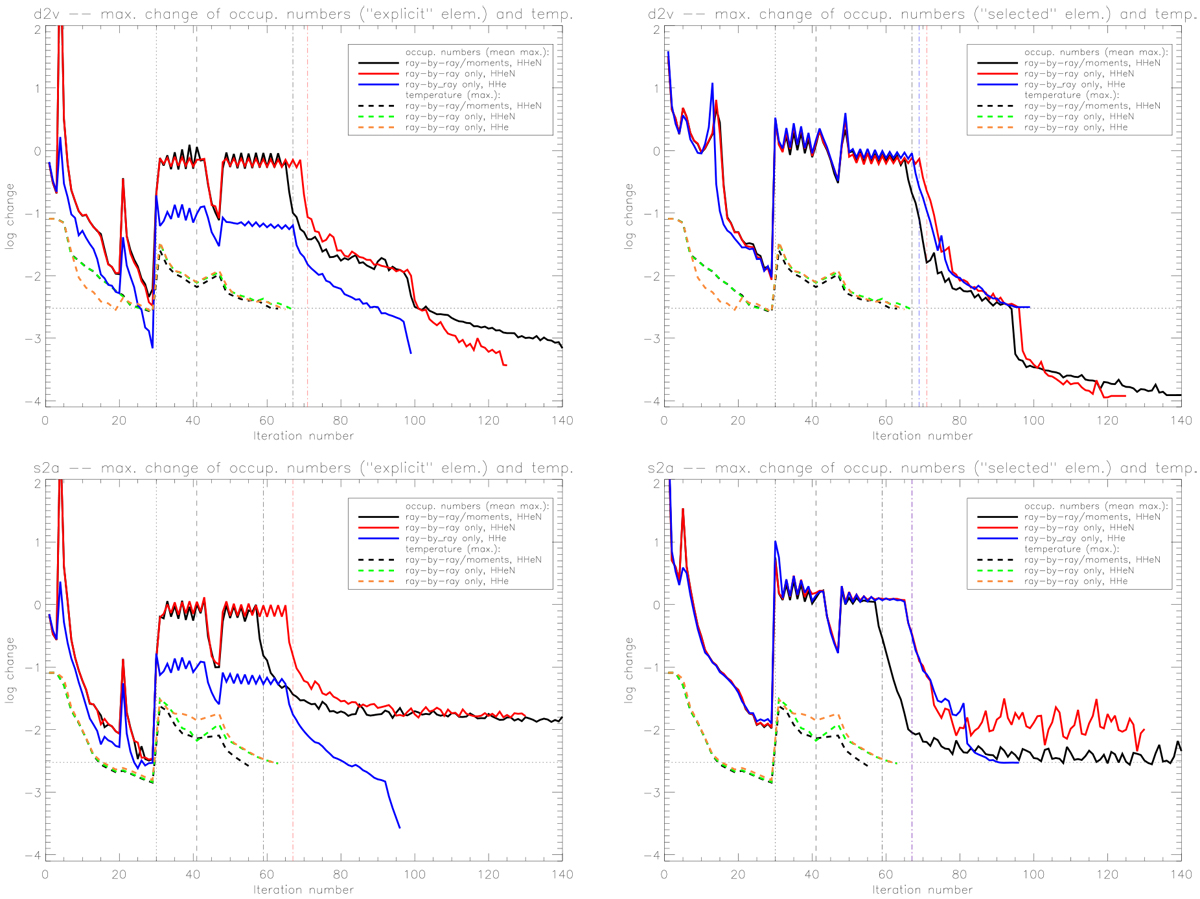
Prototypical convergence behavior for three different kinds of model calculations (see legend and text). Displayed is the maximum relative change of temperature (regarding all grid-points, dashed) within two consecutive iteration steps, and the corresponding mean of the maximum change within all specified occupation numbers, where the averaging has been performed over all depth-points with τRoss ≤ 1. Left panels: mean maximum change within occupation numbers from explicit elements (HHeN in black and red, HHe in blue); right panels: mean maximum change within occupation numbers from selected background elements. Upper and lower panels: convergence behavior for our hottest dwarf (d2v, see Table 2) and supergiant (s2a) model, respectively. Our convergence criterion for the temperature is displayed by a horizontal dotted line. The vertical lines display the onset of the detailed CMF calculations within λmin and λmax (dotted), the update of the photospheric structure (dashed), and the onset of the Ng-extrapolation scheme for the C, N, O resonancelines (dashed-dotted). See text.
Current usage metrics show cumulative count of Article Views (full-text article views including HTML views, PDF and ePub downloads, according to the available data) and Abstracts Views on Vision4Press platform.
Data correspond to usage on the plateform after 2015. The current usage metrics is available 48-96 hours after online publication and is updated daily on week days.
Initial download of the metrics may take a while.