Fig. A.2
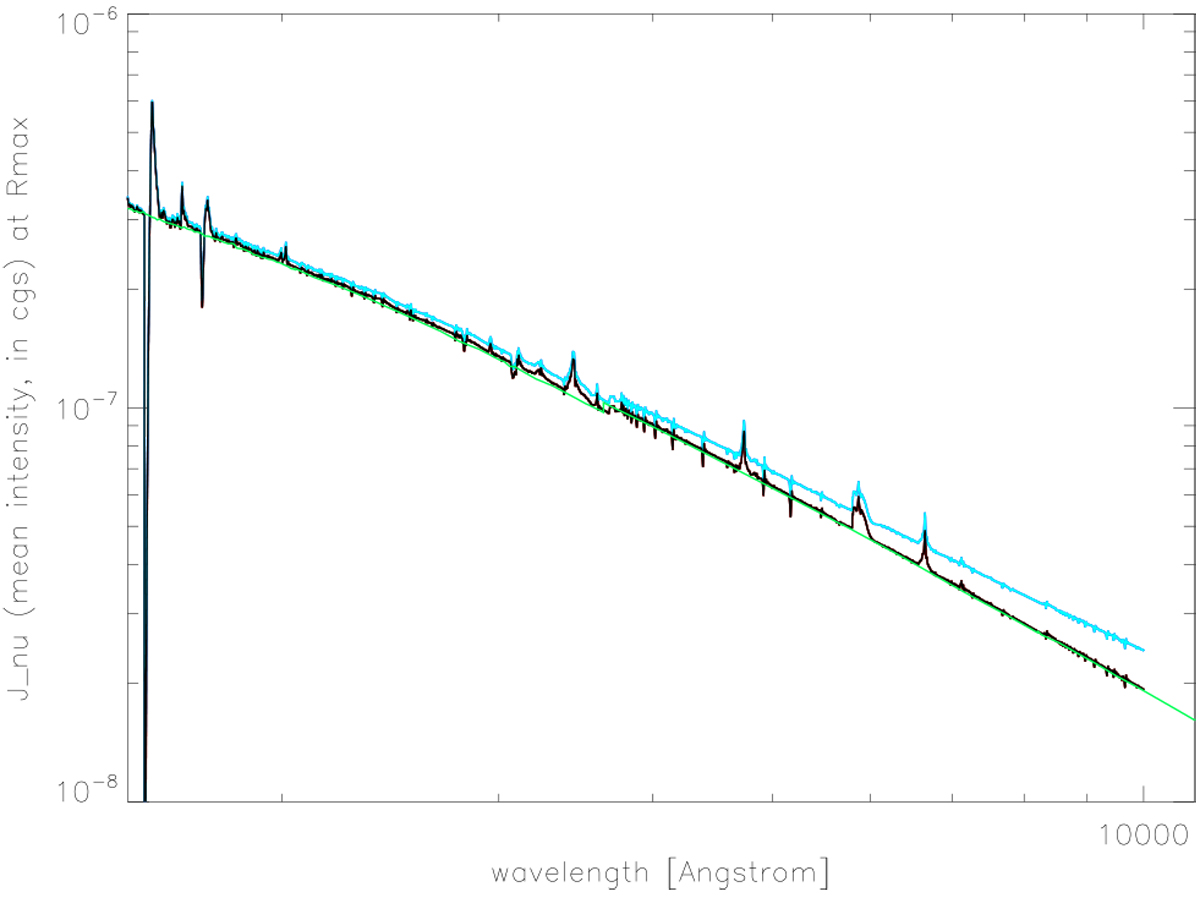
As Fig. A.1, but for λ = 1500−11 000 Å. The impact of the frequency derivative (turquoise versus black) is clearly visible. Without inclusion, no smooth transition between detailed and approximate treatment (at λmax = 10 000 Å) would be possible. Setting I− to zero at all frequencies (red curve in Fig. A.1) results in a flux-distribution identical to the black one in the optical range, whereas specifying I− ≠ 0 only for optically thick lines and continua, and neglecting the frequency gradient (dark blue curve in Fig. A.1), results in fluxes similar to the turquoise ones.
Current usage metrics show cumulative count of Article Views (full-text article views including HTML views, PDF and ePub downloads, according to the available data) and Abstracts Views on Vision4Press platform.
Data correspond to usage on the plateform after 2015. The current usage metrics is available 48-96 hours after online publication and is updated daily on week days.
Initial download of the metrics may take a while.