Fig. 16
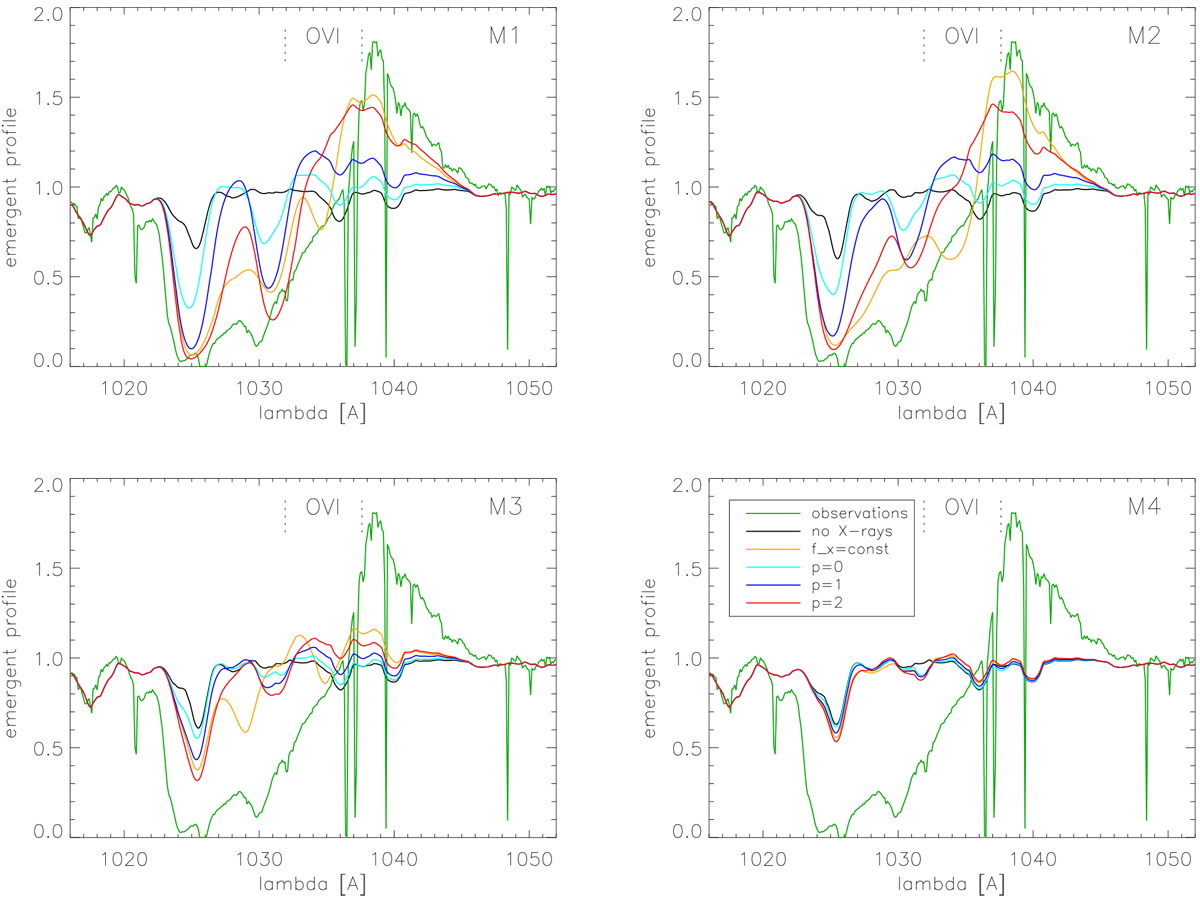
Synthetic line profiles for the UV resonance doublet of O VI, for the same stellar model and different shock distributions as in Fig. 13 (M1, upper left), and for three other models (M2 to M4) differing in mass-loss rate and clumping properties (see Table. 5). Same color coding as in Fig. 15. Profiles from the smooth-wind models M1 and M2 are close to being identical, though mass-loss rates differ by a factorof four. All spectra have been calculated with a depth dependent “micro-turbulence” (proportional to v(r), with a minimum of 15 km s−1, and a maximum of 0.1v∞), and convolved with v sin i = 220 km s−1. For comparison, the observed COPERNICUS spectrum (at a resolution of 0.2 Å, Snow & Jenkins 1977) is displayed in dark green. The dotted lines at the top display the rest-frame frequencies of the doublet components. The absorption feature around 1215 Å, visible in all synthetic spectra without significant O VI contribution, is stellar Lyβ. Model M1 and M4 and corresponding spectra (for fX = const.) are very similar to those displayed (and discussed) by Zsargó et al. (2008) in their Fig. 1.
Current usage metrics show cumulative count of Article Views (full-text article views including HTML views, PDF and ePub downloads, according to the available data) and Abstracts Views on Vision4Press platform.
Data correspond to usage on the plateform after 2015. The current usage metrics is available 48-96 hours after online publication and is updated daily on week days.
Initial download of the metrics may take a while.