Fig. 13
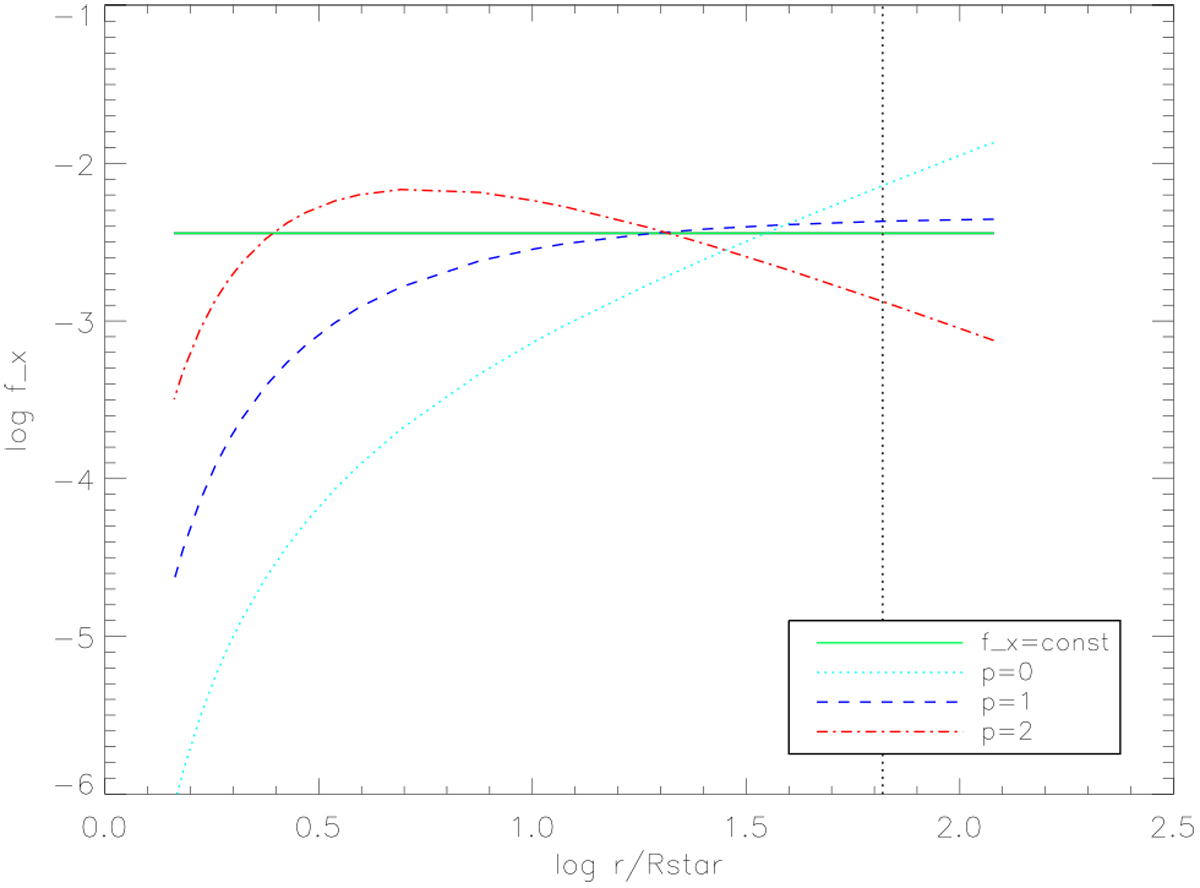
X-ray volume filling factor, fX, as a function of log r∕R*, for different shock distributions parameterized according to Eqs. (8) and (12) (see legend, and Table 4), and stellar and wind parameters for our ζ Pup-like model (Table 3). The vertical dotted line denotes the region where cooling and wind flow times are equal, tc = tf. Due to the large mass-loss rate, the ratio ls∕rs remains smaller than unity throughout the wind.
Current usage metrics show cumulative count of Article Views (full-text article views including HTML views, PDF and ePub downloads, according to the available data) and Abstracts Views on Vision4Press platform.
Data correspond to usage on the plateform after 2015. The current usage metrics is available 48-96 hours after online publication and is updated daily on week days.
Initial download of the metrics may take a while.