Fig. 1
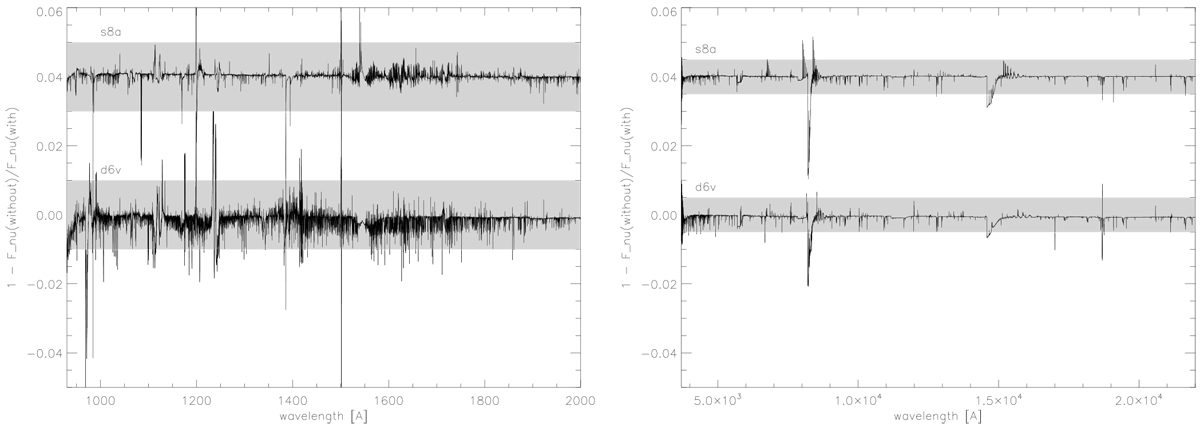
Effects of level dissolution in the UV (left) and the optical and NIR (right), for models s8a and d6v (see Table 2). Displayed is the deviation of the emergent fluxes,
![]() , without and with accounting for level dissolution, as calculated by CMFGEN. The results for model s8a have been vertically shifted by 0.04. To guide the eye, the gray-shaded region refers to deviations of ± 1% for the UV range, and of ±0.5% for the optical and NIR range, respectively. For clarity, wavelength ranges with λ < 930 Å and λ < 3700 Å (regions close to the Lyman and Balmer edges, where, as expected, larger changes are found) are not displayed. All wavelengths refer to vacuum.
, without and with accounting for level dissolution, as calculated by CMFGEN. The results for model s8a have been vertically shifted by 0.04. To guide the eye, the gray-shaded region refers to deviations of ± 1% for the UV range, and of ±0.5% for the optical and NIR range, respectively. For clarity, wavelength ranges with λ < 930 Å and λ < 3700 Å (regions close to the Lyman and Balmer edges, where, as expected, larger changes are found) are not displayed. All wavelengths refer to vacuum.
Current usage metrics show cumulative count of Article Views (full-text article views including HTML views, PDF and ePub downloads, according to the available data) and Abstracts Views on Vision4Press platform.
Data correspond to usage on the plateform after 2015. The current usage metrics is available 48-96 hours after online publication and is updated daily on week days.
Initial download of the metrics may take a while.