Free Access
Fig. 3.
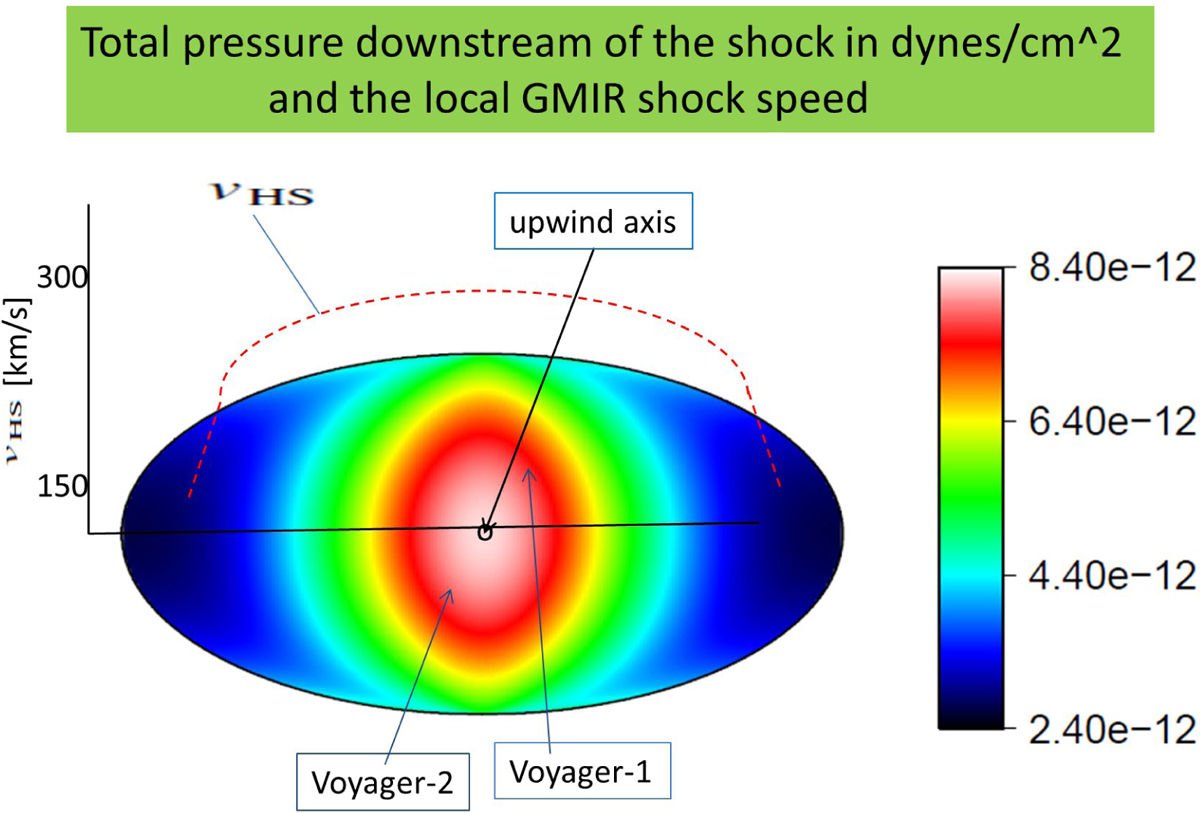
Total downstream pressure in dynes cm−2, displayed in a Mollweide plot in galactic coordinates. Copyright by Fahr & Siewert (2013) (upwind nose is in the center; solar maximum configuration). The dashed red curve gives the sound velocity vHS (see left scale) at an ecliptic cut.
Current usage metrics show cumulative count of Article Views (full-text article views including HTML views, PDF and ePub downloads, according to the available data) and Abstracts Views on Vision4Press platform.
Data correspond to usage on the plateform after 2015. The current usage metrics is available 48-96 hours after online publication and is updated daily on week days.
Initial download of the metrics may take a while.