Fig. 7.
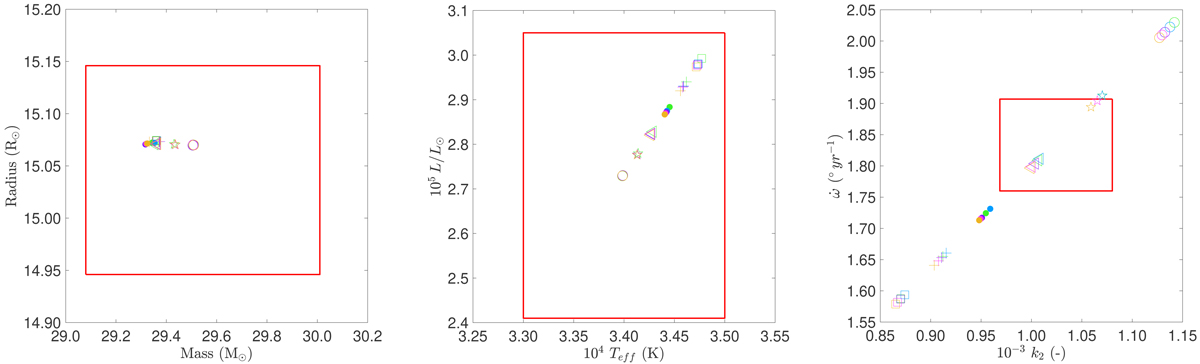
Position of the best-fit min-Clés models: in the (M, R)-plane (left panel), in the (Teff, L/L⊙)-plane (middle panel), and in the (k2, ![]() )-plane (right panel) for the five Series (see text): XII (αov = 0.20, green), XIII (αov = 0.25, blue), XIV (αov = 0.30, violet), XV (αov = 0.35, pink), and XVI (αov = 0.40, orange). Each symbol corresponds to a different value of DT: The lowest absolute value (which corresponds to the best-fit of M, R, Teff, and L) is depicted by an open circle, while increasing absolute values of DT are depicted, in ascending order, by a star, an open triangle, a filled dot, a cross, and an open square. The red square represents the observational box, that is to say, the range of observational values taking into account the error bars.
)-plane (right panel) for the five Series (see text): XII (αov = 0.20, green), XIII (αov = 0.25, blue), XIV (αov = 0.30, violet), XV (αov = 0.35, pink), and XVI (αov = 0.40, orange). Each symbol corresponds to a different value of DT: The lowest absolute value (which corresponds to the best-fit of M, R, Teff, and L) is depicted by an open circle, while increasing absolute values of DT are depicted, in ascending order, by a star, an open triangle, a filled dot, a cross, and an open square. The red square represents the observational box, that is to say, the range of observational values taking into account the error bars.
Current usage metrics show cumulative count of Article Views (full-text article views including HTML views, PDF and ePub downloads, according to the available data) and Abstracts Views on Vision4Press platform.
Data correspond to usage on the plateform after 2015. The current usage metrics is available 48-96 hours after online publication and is updated daily on week days.
Initial download of the metrics may take a while.