Fig. 3.
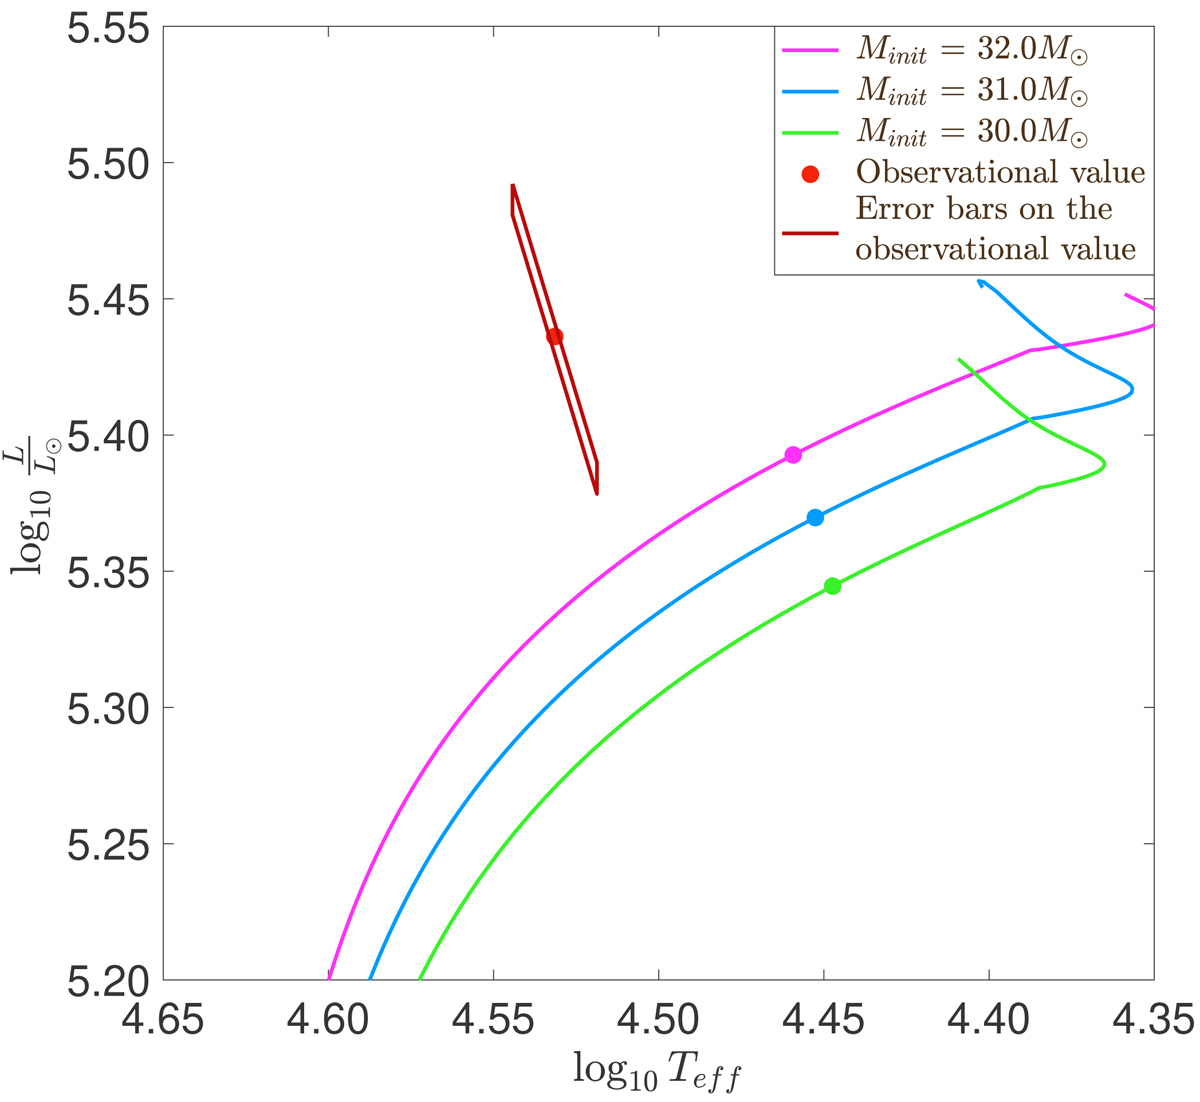
Hertzsprung-Russell diagram: evolutionary tracks of Clés models with initial masses of 30.0 (green), 31.0 (light blue), and 32.0 M⊙ (pink), overshooting parameter of 0.20, Z = 0.015, and no turbulent diffusion. Stellar mass-loss was computed according to the formalism of Vink et al. (2001), with ξ = 1. The three dots over-plotted on the corresponding tracks correspond to the models that fit the observational k2. The observational value is represented by the red point and its error bars, computed through the effective temperature and the radius, are represented by the dark red parallelogram.
Current usage metrics show cumulative count of Article Views (full-text article views including HTML views, PDF and ePub downloads, according to the available data) and Abstracts Views on Vision4Press platform.
Data correspond to usage on the plateform after 2015. The current usage metrics is available 48-96 hours after online publication and is updated daily on week days.
Initial download of the metrics may take a while.