Fig. 5
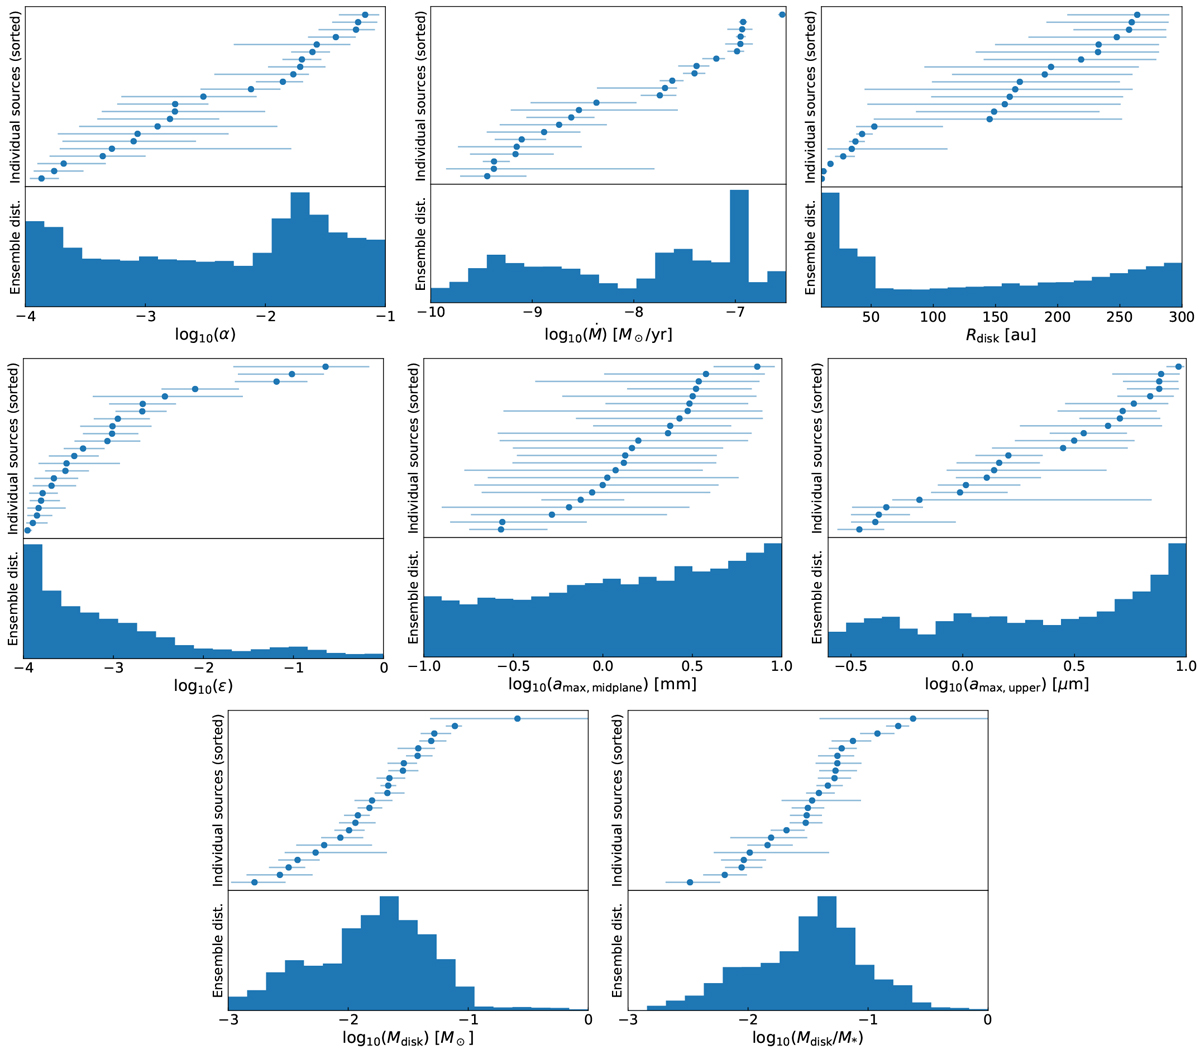
Results for individual sources (top panels) and ensemble distribution (bottom panels) of each relevant parameter for the sample of 23 disks modeled in our study. Top panels: parameter value (blue dot) for each source, sorted by increasing value. The errorbars are the corresponding 16 and 84% percentiles. The ensembles in the bottom panels show the overall distribution of the sample, and are produced by randomly selecting 1000 values from the posterior distribution of each object, and then combining all of them.
Current usage metrics show cumulative count of Article Views (full-text article views including HTML views, PDF and ePub downloads, according to the available data) and Abstracts Views on Vision4Press platform.
Data correspond to usage on the plateform after 2015. The current usage metrics is available 48-96 hours after online publication and is updated daily on week days.
Initial download of the metrics may take a while.