Free Access
Fig. 3
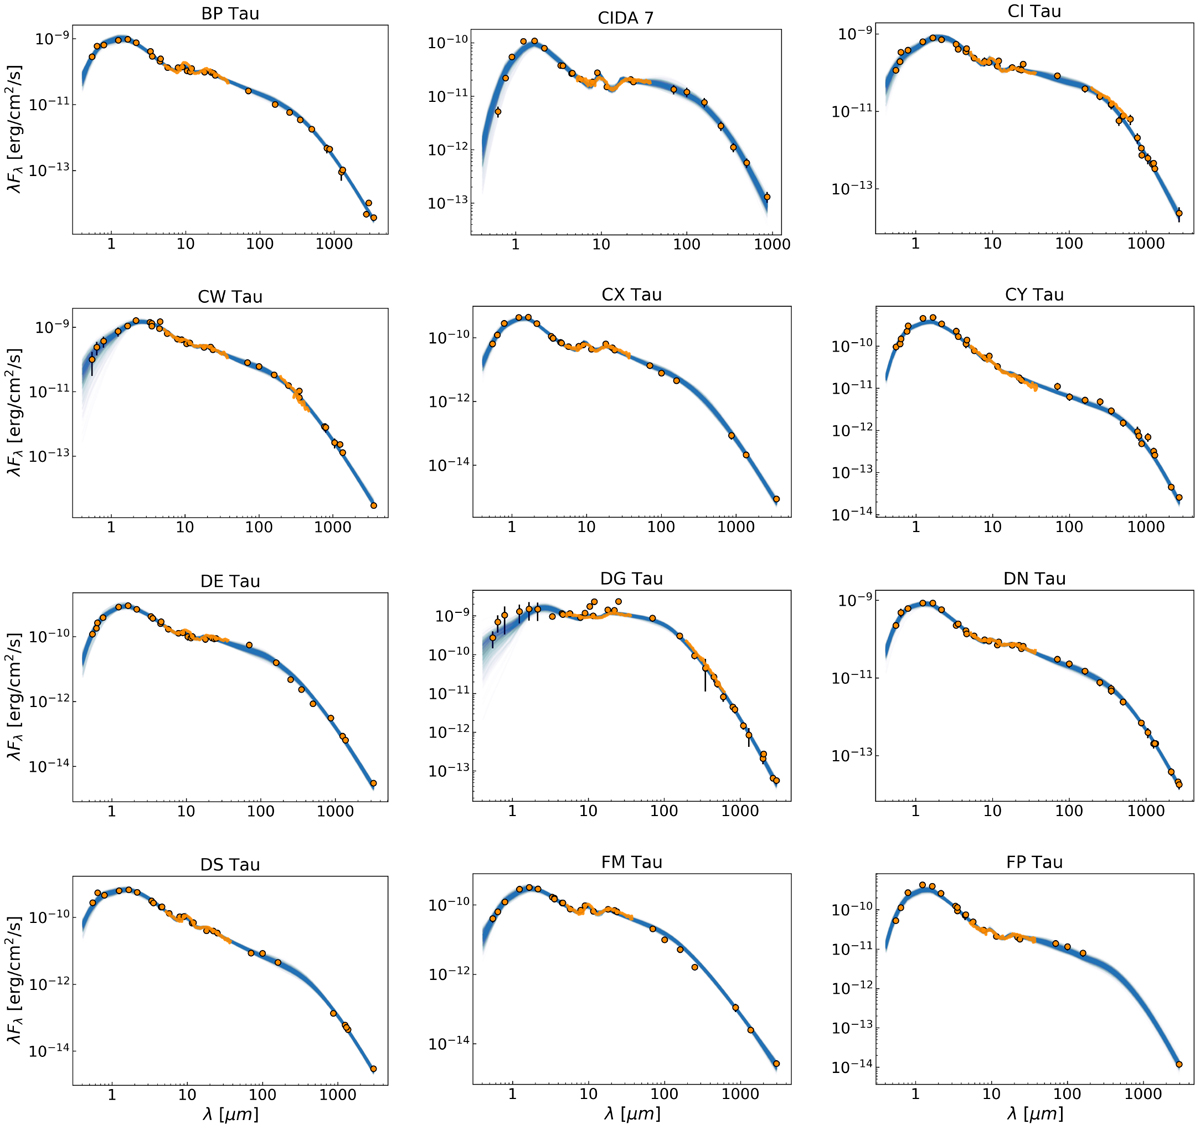
SEDs of the 23 sources successfully fit in this study. The observed photometric data (orange dots) and the IRS/Spitzer and SPIRE/Herschel spectra (orange line, when available) are shown. We also plot the results of the modeling process by randomly selecting 1000 models (blue lines) from the posterior distributions.
Current usage metrics show cumulative count of Article Views (full-text article views including HTML views, PDF and ePub downloads, according to the available data) and Abstracts Views on Vision4Press platform.
Data correspond to usage on the plateform after 2015. The current usage metrics is available 48-96 hours after online publication and is updated daily on week days.
Initial download of the metrics may take a while.