Fig. B.4
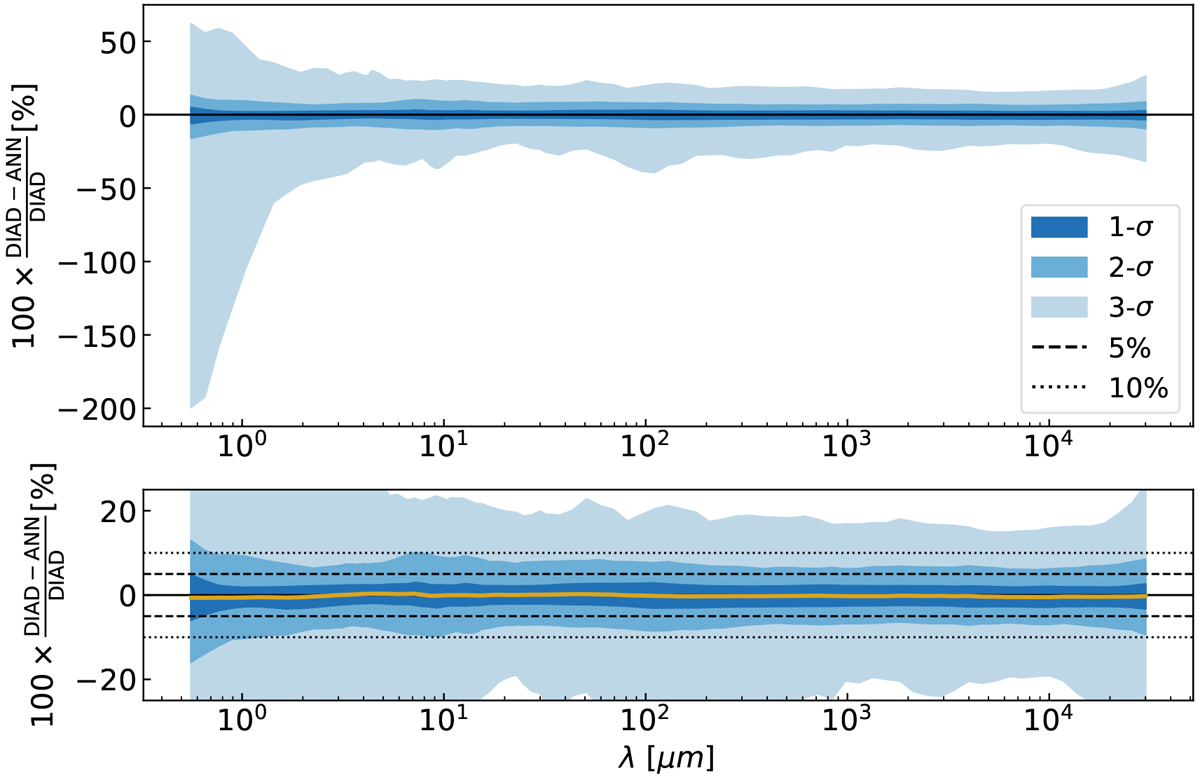
Accuracy of the ANN. For each object in the blind sample (5000 models), we estimated the difference between the SED from DIAD and the SED predicted by the ANN at each wavelength. We then estimated the 68% (1-σ), 95% (2-σ), and 99.9% (3-σ) percentiles. The yellow line corresponds to the median difference between DIAD and the ANN at each wavelength. Bottom plot: zoom to the −25% to 25% range.
Current usage metrics show cumulative count of Article Views (full-text article views including HTML views, PDF and ePub downloads, according to the available data) and Abstracts Views on Vision4Press platform.
Data correspond to usage on the plateform after 2015. The current usage metrics is available 48-96 hours after online publication and is updated daily on week days.
Initial download of the metrics may take a while.