Fig. 6.
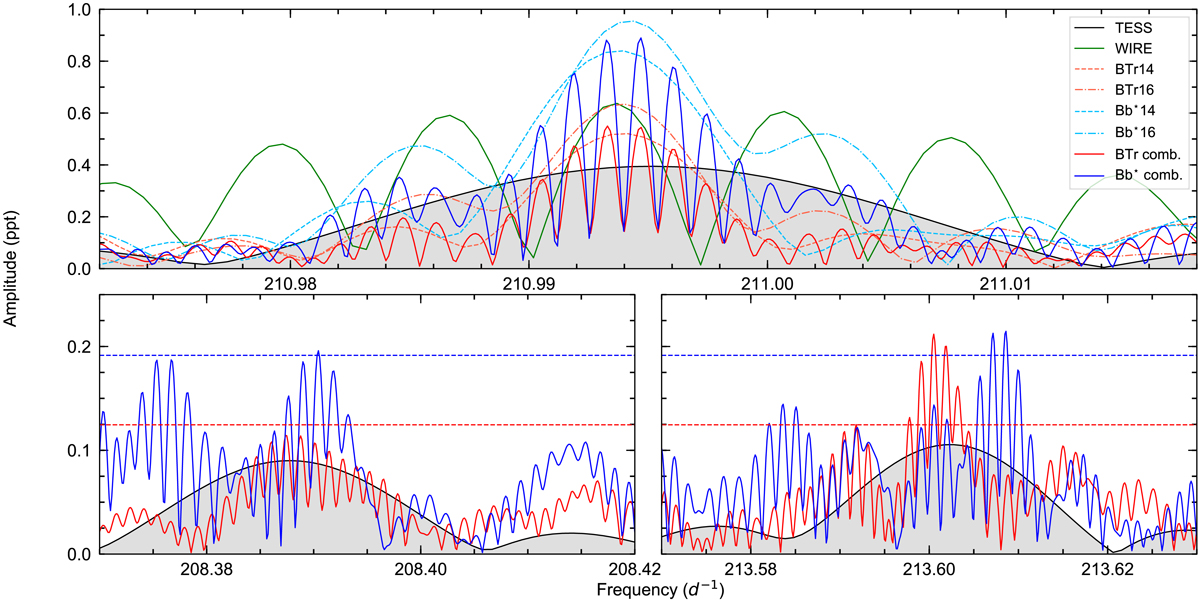
Fourier amplitude spectra of the TESS and BRITE photometry centred on f1 (top), f6 (bottom left), and f7 (bottom right). Bb⋆ represents the combined blue data obtained with BAb and BLb. BTr14, BTr16, Bb⋆14, and Bb⋆16 are the red and blue BRITE data, obtained during the years 2014 and 2016, respectively. The BRITE-blue spectra amplitudes are divided by two for better comparison with the other data. Dashed lines indicate a S/N of three.
Current usage metrics show cumulative count of Article Views (full-text article views including HTML views, PDF and ePub downloads, according to the available data) and Abstracts Views on Vision4Press platform.
Data correspond to usage on the plateform after 2015. The current usage metrics is available 48-96 hours after online publication and is updated daily on week days.
Initial download of the metrics may take a while.