Fig. 5.
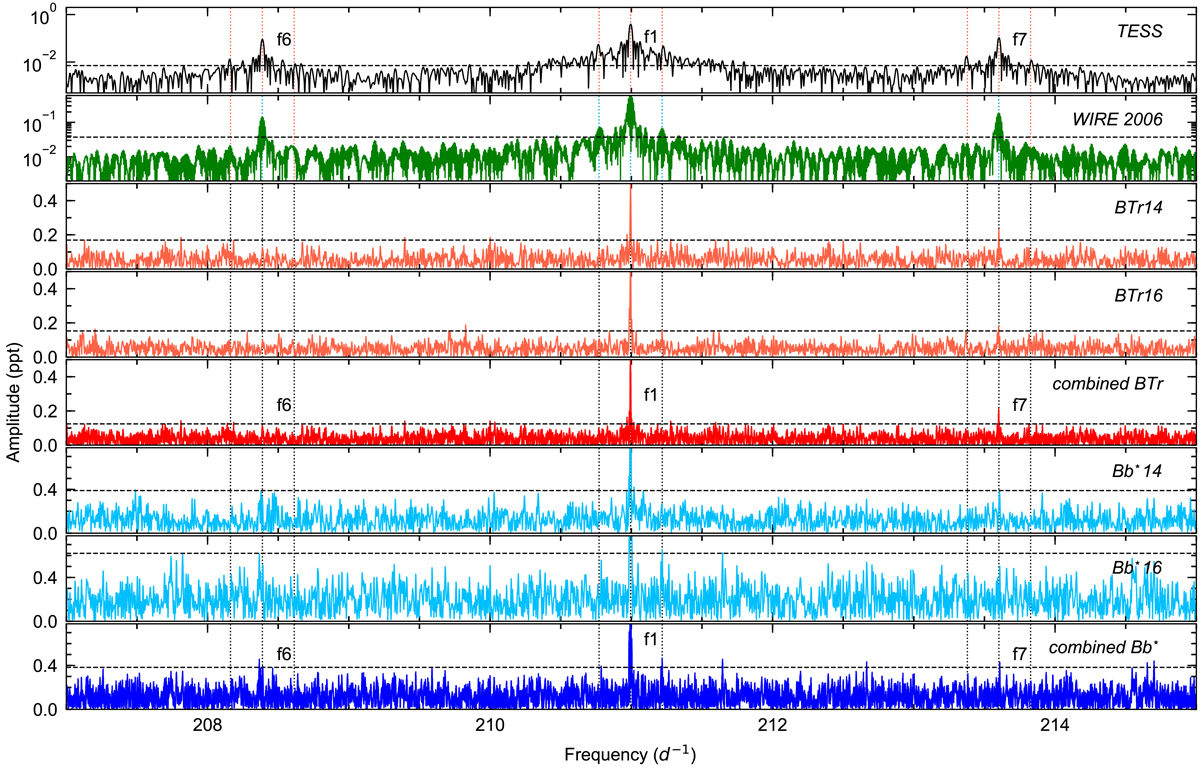
Fourier amplitude spectra from different sources around the primary pulsation period of α Cir. Bb⋆ represents the combined blue data from BAb and BLb. BTr14, BTr16, Bb⋆14, and Bb⋆16 are the red and blue BRITE data, obtained during the years 2014 and 2016, respectively. Vertical dotted lines indicate the oscillation modes and the rotational side lobes identified in the TESS data. Horizontal dashed lines mark a S/N = 3. We note that the two upper panels have a logarithmic scaling and that many peaks formally exceed the S/N = 3 limit in the TESS data, which are caused by the spectral window, as is typical for high S/N data. The y-scale of the other panels, however, is chosen to distinguish the noise, f6 and f7.
Current usage metrics show cumulative count of Article Views (full-text article views including HTML views, PDF and ePub downloads, according to the available data) and Abstracts Views on Vision4Press platform.
Data correspond to usage on the plateform after 2015. The current usage metrics is available 48-96 hours after online publication and is updated daily on week days.
Initial download of the metrics may take a while.