Fig. 3.
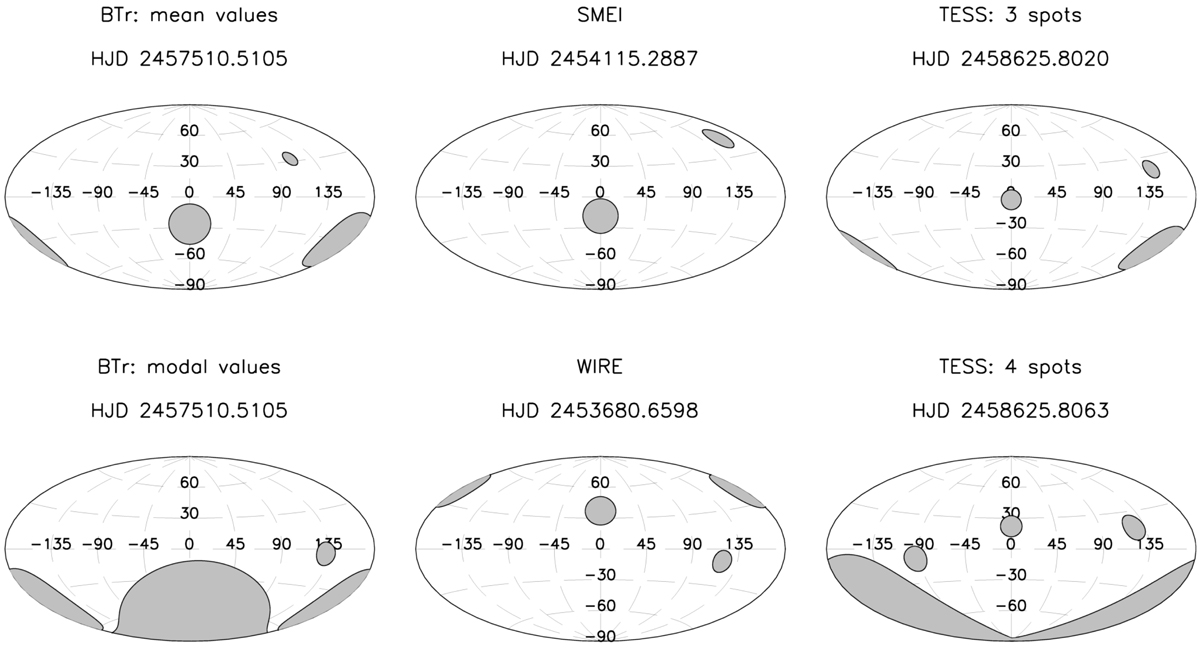
HJDs are transit times of the spot that contributes most to the light curve (spot 1). Left: BTr-based maps (top: mean values; bottom: modal values). Middle: SMEI mean map, which allows for only two spots (top) and WIRE (bottom), which indicates a three-spot map. Right: comparison of TESS mean maps allowing for three spots (top) and four spots (bottom).
Current usage metrics show cumulative count of Article Views (full-text article views including HTML views, PDF and ePub downloads, according to the available data) and Abstracts Views on Vision4Press platform.
Data correspond to usage on the plateform after 2015. The current usage metrics is available 48-96 hours after online publication and is updated daily on week days.
Initial download of the metrics may take a while.