Fig. 1.
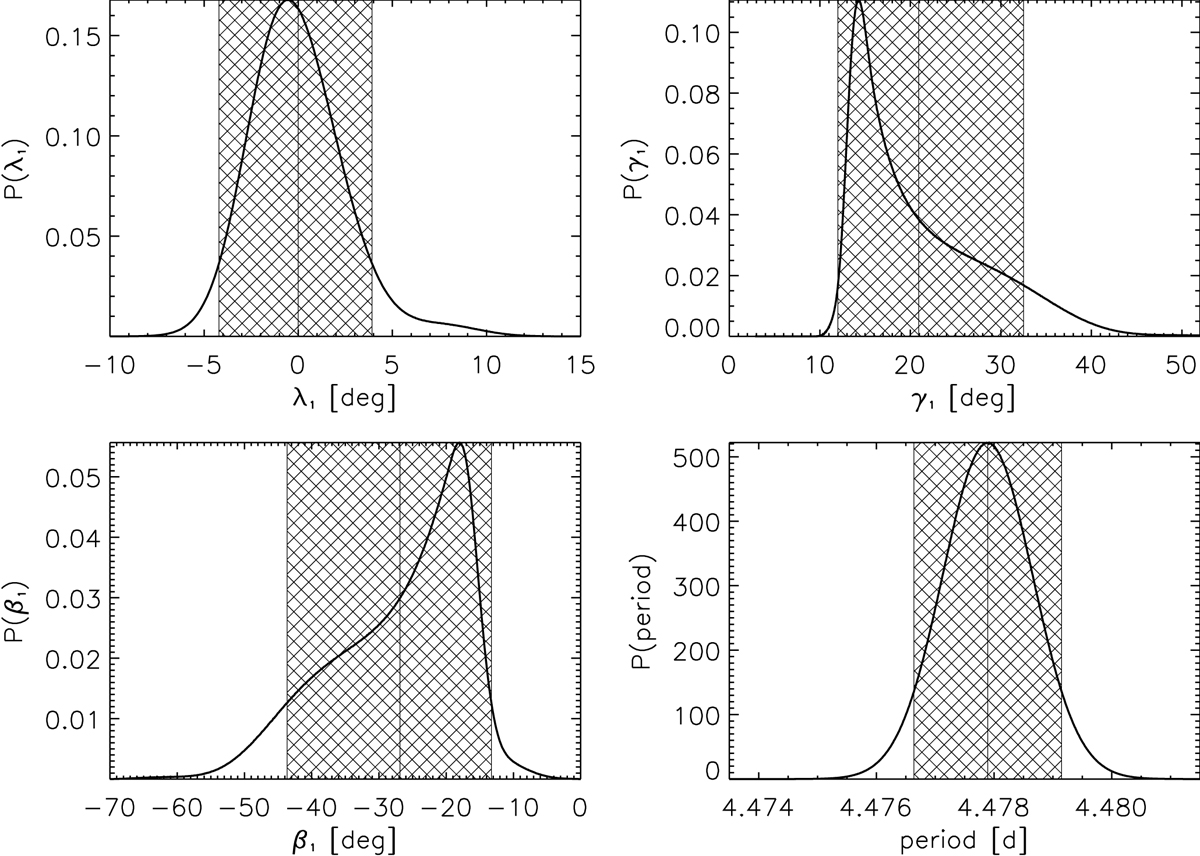
Left: spot 1 marginal distributions of longitude (λ) and latitude (β) in degrees. Right: spot radius (γ) and period in days. All for BTr data. The vertical lines indicate the mean and the 90% credibility limits (shaded area). Because of the skewness of the distribution (curved line) the locus of maximum probability does not necessarily coincide with a parameter’s mean value and deviates from the global mode given in Table 3 for BTr.
Current usage metrics show cumulative count of Article Views (full-text article views including HTML views, PDF and ePub downloads, according to the available data) and Abstracts Views on Vision4Press platform.
Data correspond to usage on the plateform after 2015. The current usage metrics is available 48-96 hours after online publication and is updated daily on week days.
Initial download of the metrics may take a while.