Free Access
Fig. 9.
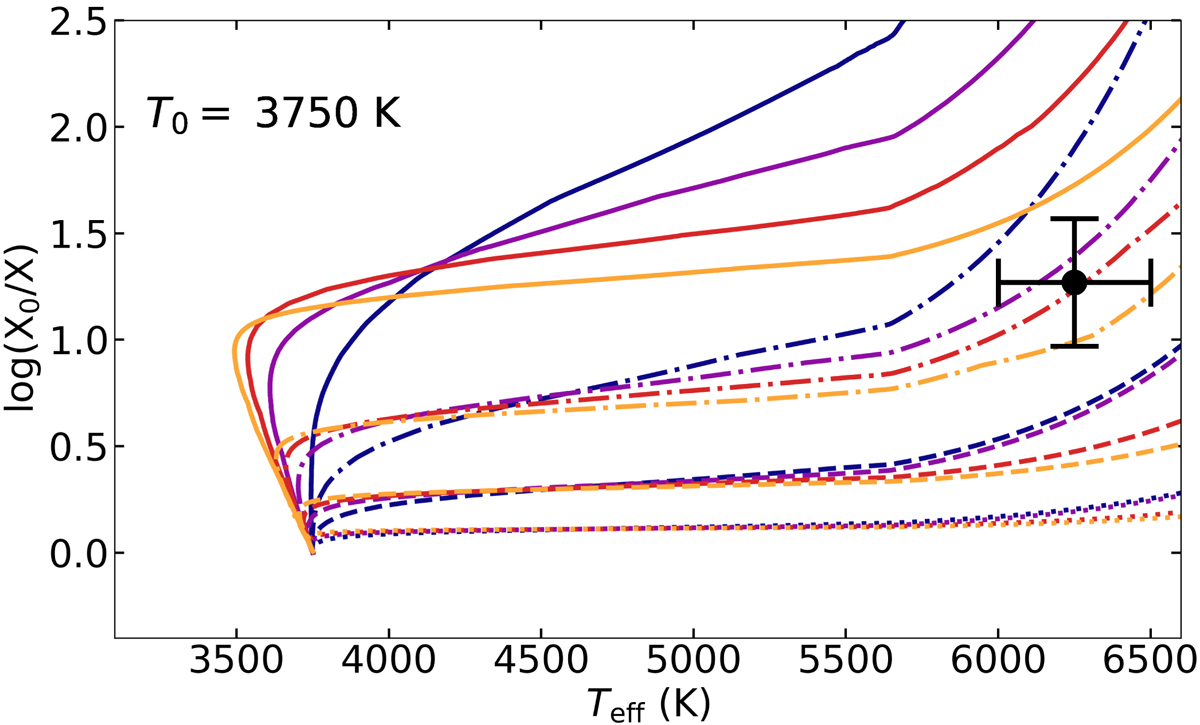
Same as the bottom panel of Fig. 1 (with T0 = 3750 K), but for models with a stellar wind which is a factor of 100 weaker. In this case, more massive discs are required to explain the observed depletion pattern due to the longer evolution timescale.
Current usage metrics show cumulative count of Article Views (full-text article views including HTML views, PDF and ePub downloads, according to the available data) and Abstracts Views on Vision4Press platform.
Data correspond to usage on the plateform after 2015. The current usage metrics is available 48-96 hours after online publication and is updated daily on week days.
Initial download of the metrics may take a while.