Fig. 5.
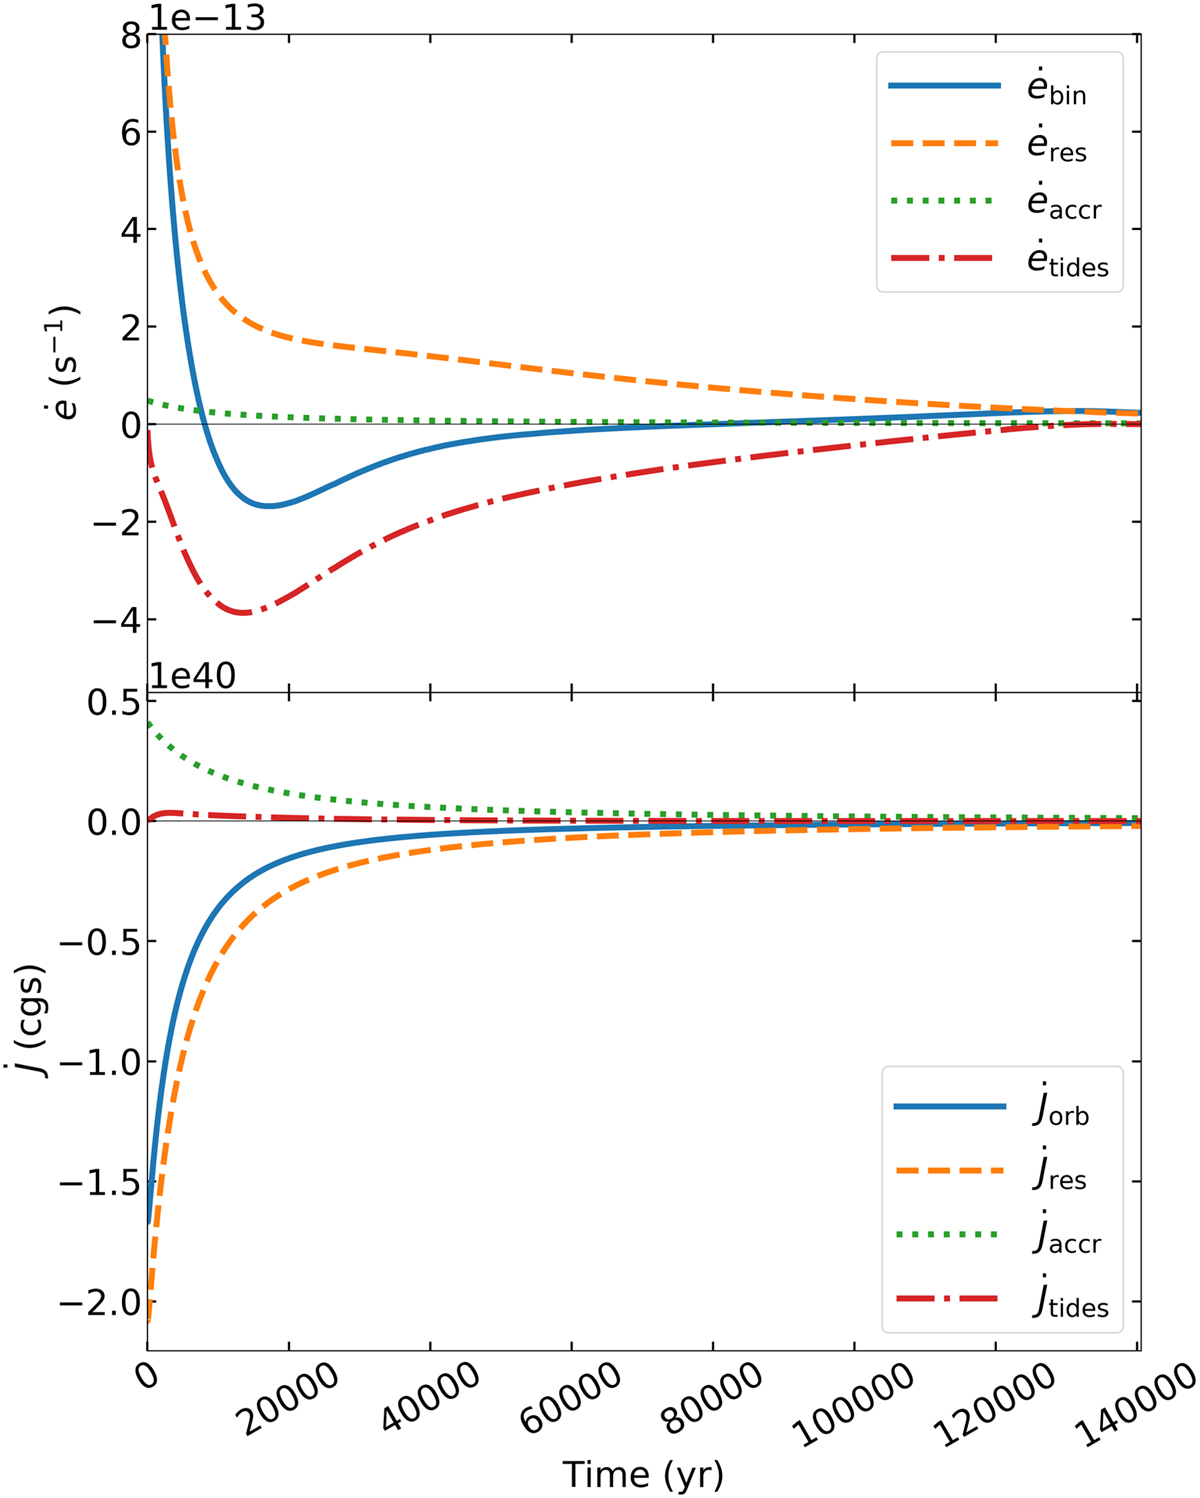
Time evolution of ė (top panel) and ![]() (bottom panel) for the different mechanisms used in case 1 for HD 46703. The parameters used in this model are Md, 0 = 10−1.5 M⊙ and Ṁ0 = 10−6.0 M⊙ yr−1 with T0 = 3250 K, which corresponds to the solid orange line in the top panel of Fig. 4. The solid blue line represents the sum of the three other effects, i.e. resonances, accretion, and tides. The two most important effects on the orbital evolution are resonances and tides.
(bottom panel) for the different mechanisms used in case 1 for HD 46703. The parameters used in this model are Md, 0 = 10−1.5 M⊙ and Ṁ0 = 10−6.0 M⊙ yr−1 with T0 = 3250 K, which corresponds to the solid orange line in the top panel of Fig. 4. The solid blue line represents the sum of the three other effects, i.e. resonances, accretion, and tides. The two most important effects on the orbital evolution are resonances and tides.
Current usage metrics show cumulative count of Article Views (full-text article views including HTML views, PDF and ePub downloads, according to the available data) and Abstracts Views on Vision4Press platform.
Data correspond to usage on the plateform after 2015. The current usage metrics is available 48-96 hours after online publication and is updated daily on week days.
Initial download of the metrics may take a while.