Fig. 4.
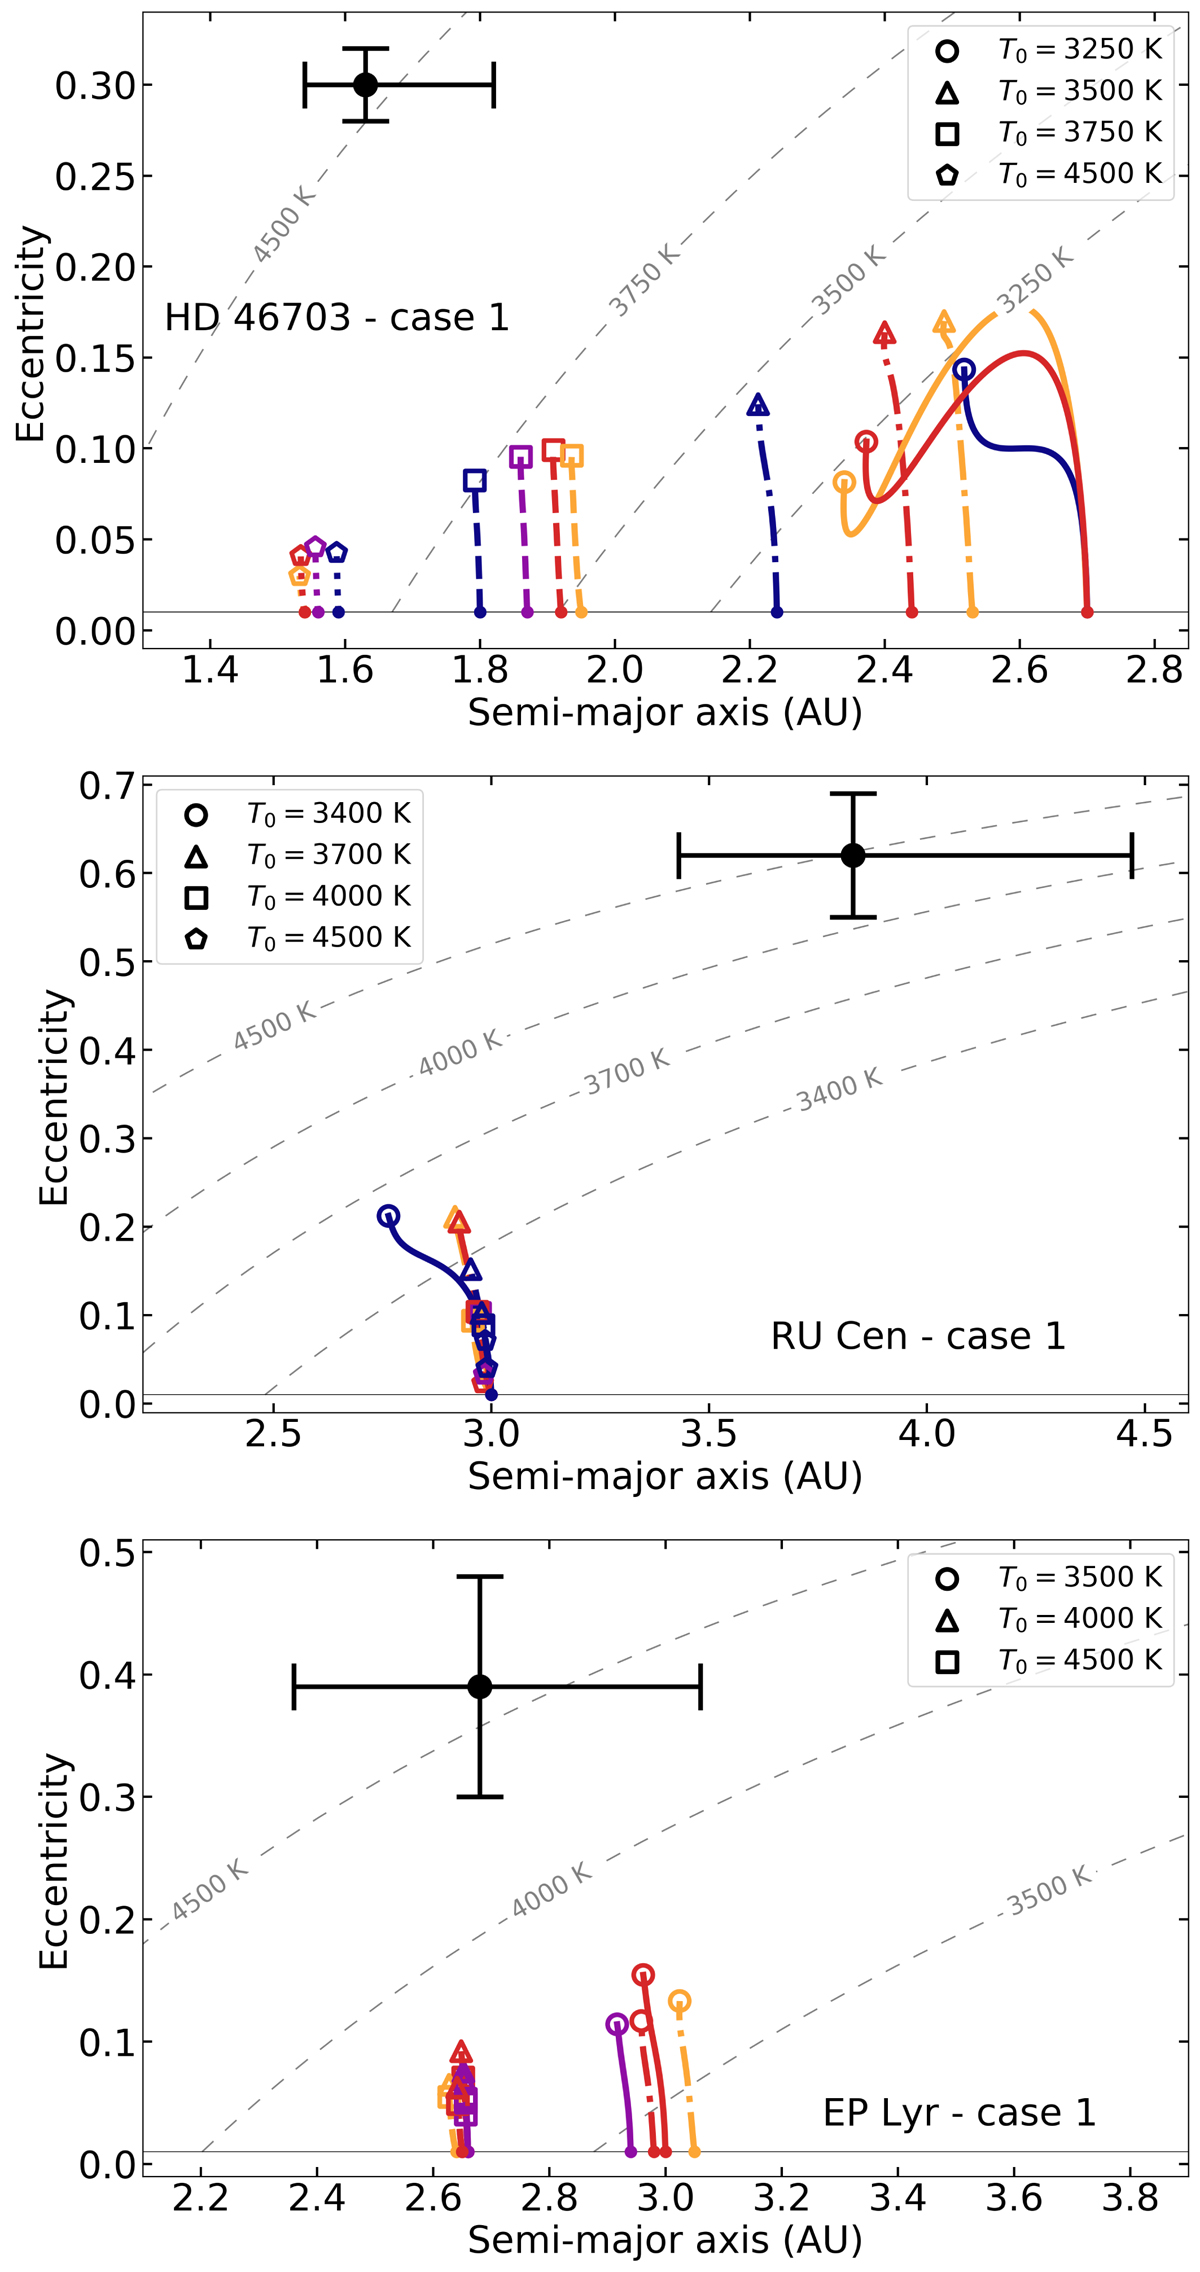
Best-fitting models in the e vs. ab plane for case 1 with both accretion and resonance torques. The black error bars show the location for each of the stars in the sample. The line styles used in this plot are the same as for the models that fit the observations in Figs. 1–3. The symbols at the end points represent models of different T0. The models start from a circular orbit with e = 0.01, which is shown by the thin black line. The grey dashed curves are lines of constant RL, in which the given temperature corresponds to the radius for this star’s luminosity such that R* = RL. Models for HD 46703 are shown in the top panel, for RU Cen in the middle panel, and for EP Lyr in the bottom panel.
Current usage metrics show cumulative count of Article Views (full-text article views including HTML views, PDF and ePub downloads, according to the available data) and Abstracts Views on Vision4Press platform.
Data correspond to usage on the plateform after 2015. The current usage metrics is available 48-96 hours after online publication and is updated daily on week days.
Initial download of the metrics may take a while.