Fig. B.1.
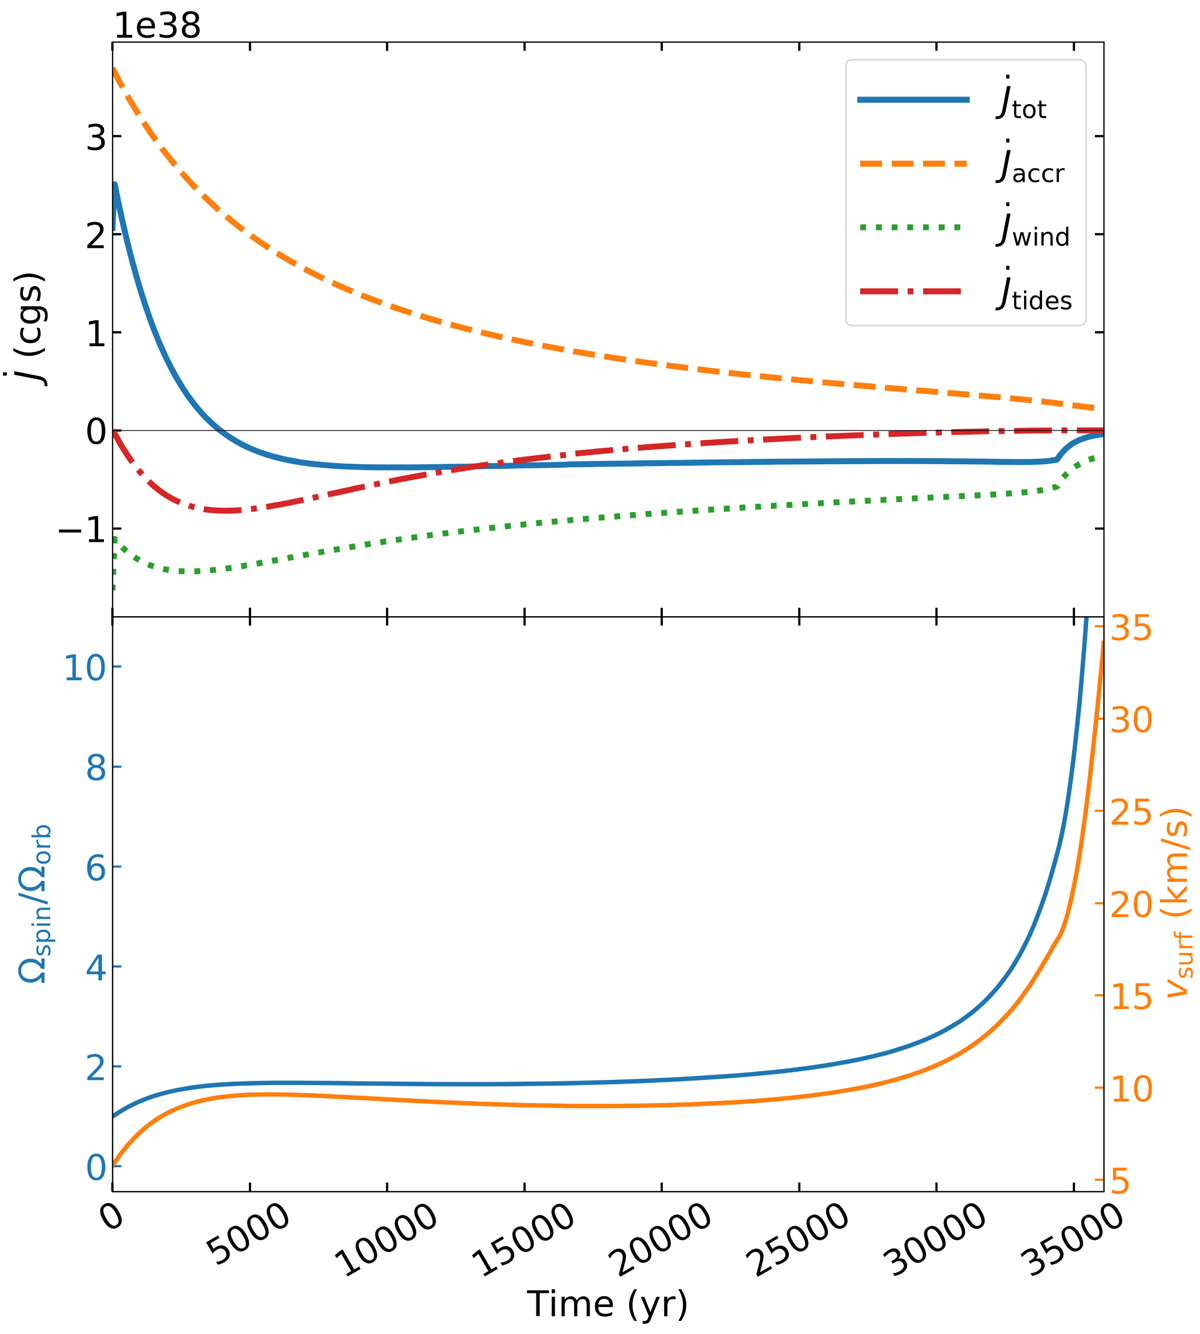
Spin evolution of HD 46703 for a model with T0 = 3500 K, Ṁ0 = 10−6.3 M⊙ yr−1, and Md, 0 = 10−2 M⊙. Upper panel: torques acting on the rotation of the post-AGB star due to accretion (dashed orange line), stellar winds (dotted green line), and tides (dash-dotted red line). Lower panel: evolution of the surface rotational velocity at the equator (orange line). The blue line gives the ratio Ωspin/Ωorb, which starts at co-rotation (=1).
Current usage metrics show cumulative count of Article Views (full-text article views including HTML views, PDF and ePub downloads, according to the available data) and Abstracts Views on Vision4Press platform.
Data correspond to usage on the plateform after 2015. The current usage metrics is available 48-96 hours after online publication and is updated daily on week days.
Initial download of the metrics may take a while.