Fig. 1.
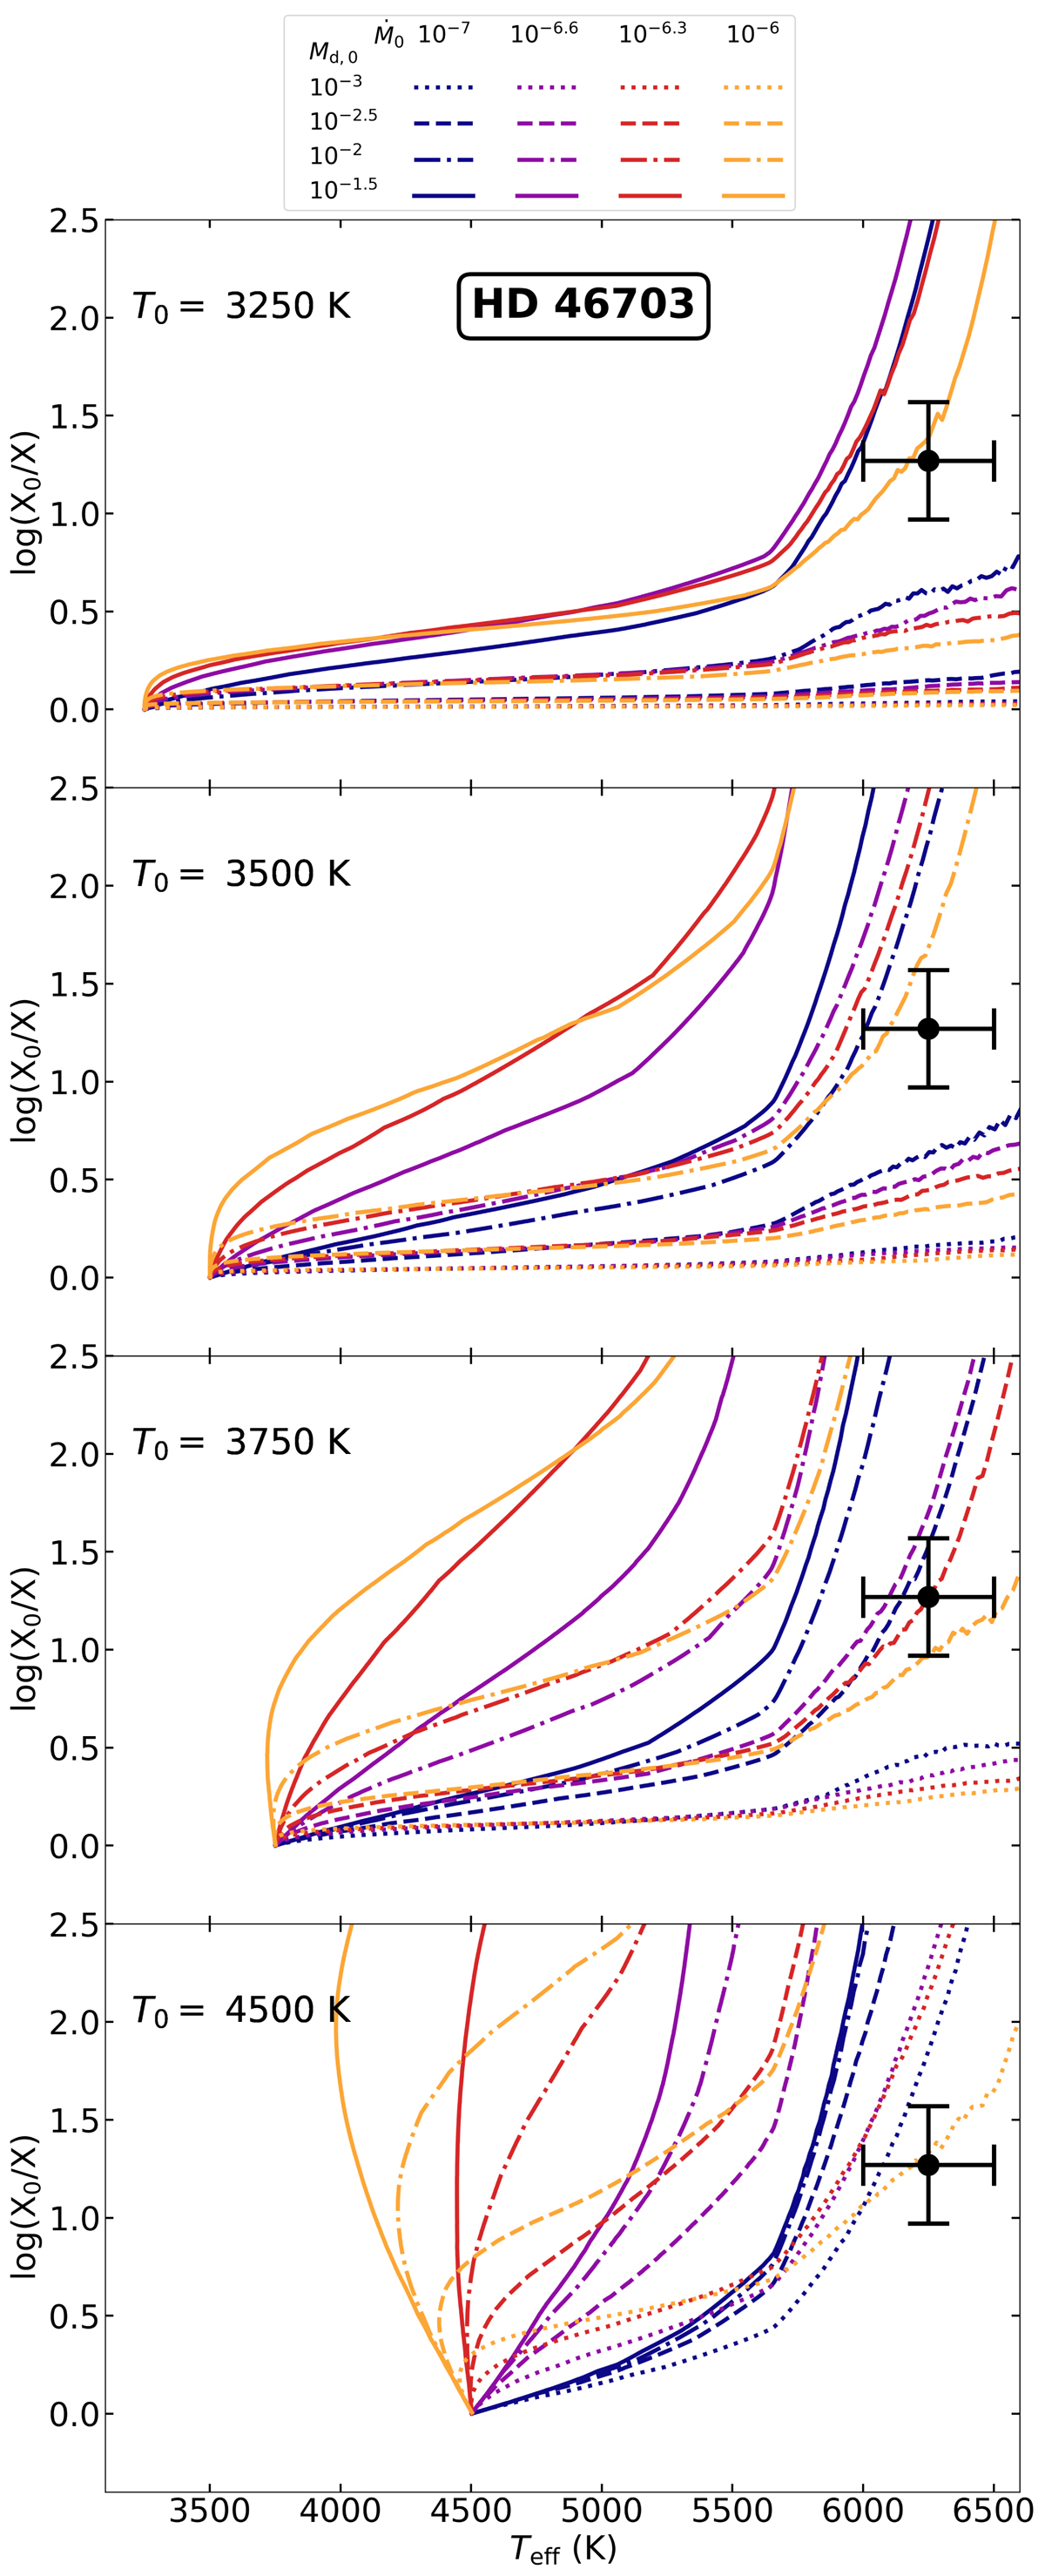
Depletion versus Teff plot for HD 46703 with starting temperatures of 3250 K, 3500 K, 3750 K, and 4500 K from top to bottom, respectively. The black error bar denotes the observed value of HD 46703. The legend is given at the top of the figure, in which different colours and line styles represent different initial accretion rates and initial disc masses, respectively. Ṁ0 is expressed in M⊙ yr−1 and Md, 0 is given in M⊙.
Current usage metrics show cumulative count of Article Views (full-text article views including HTML views, PDF and ePub downloads, according to the available data) and Abstracts Views on Vision4Press platform.
Data correspond to usage on the plateform after 2015. The current usage metrics is available 48-96 hours after online publication and is updated daily on week days.
Initial download of the metrics may take a while.