Fig. 5.
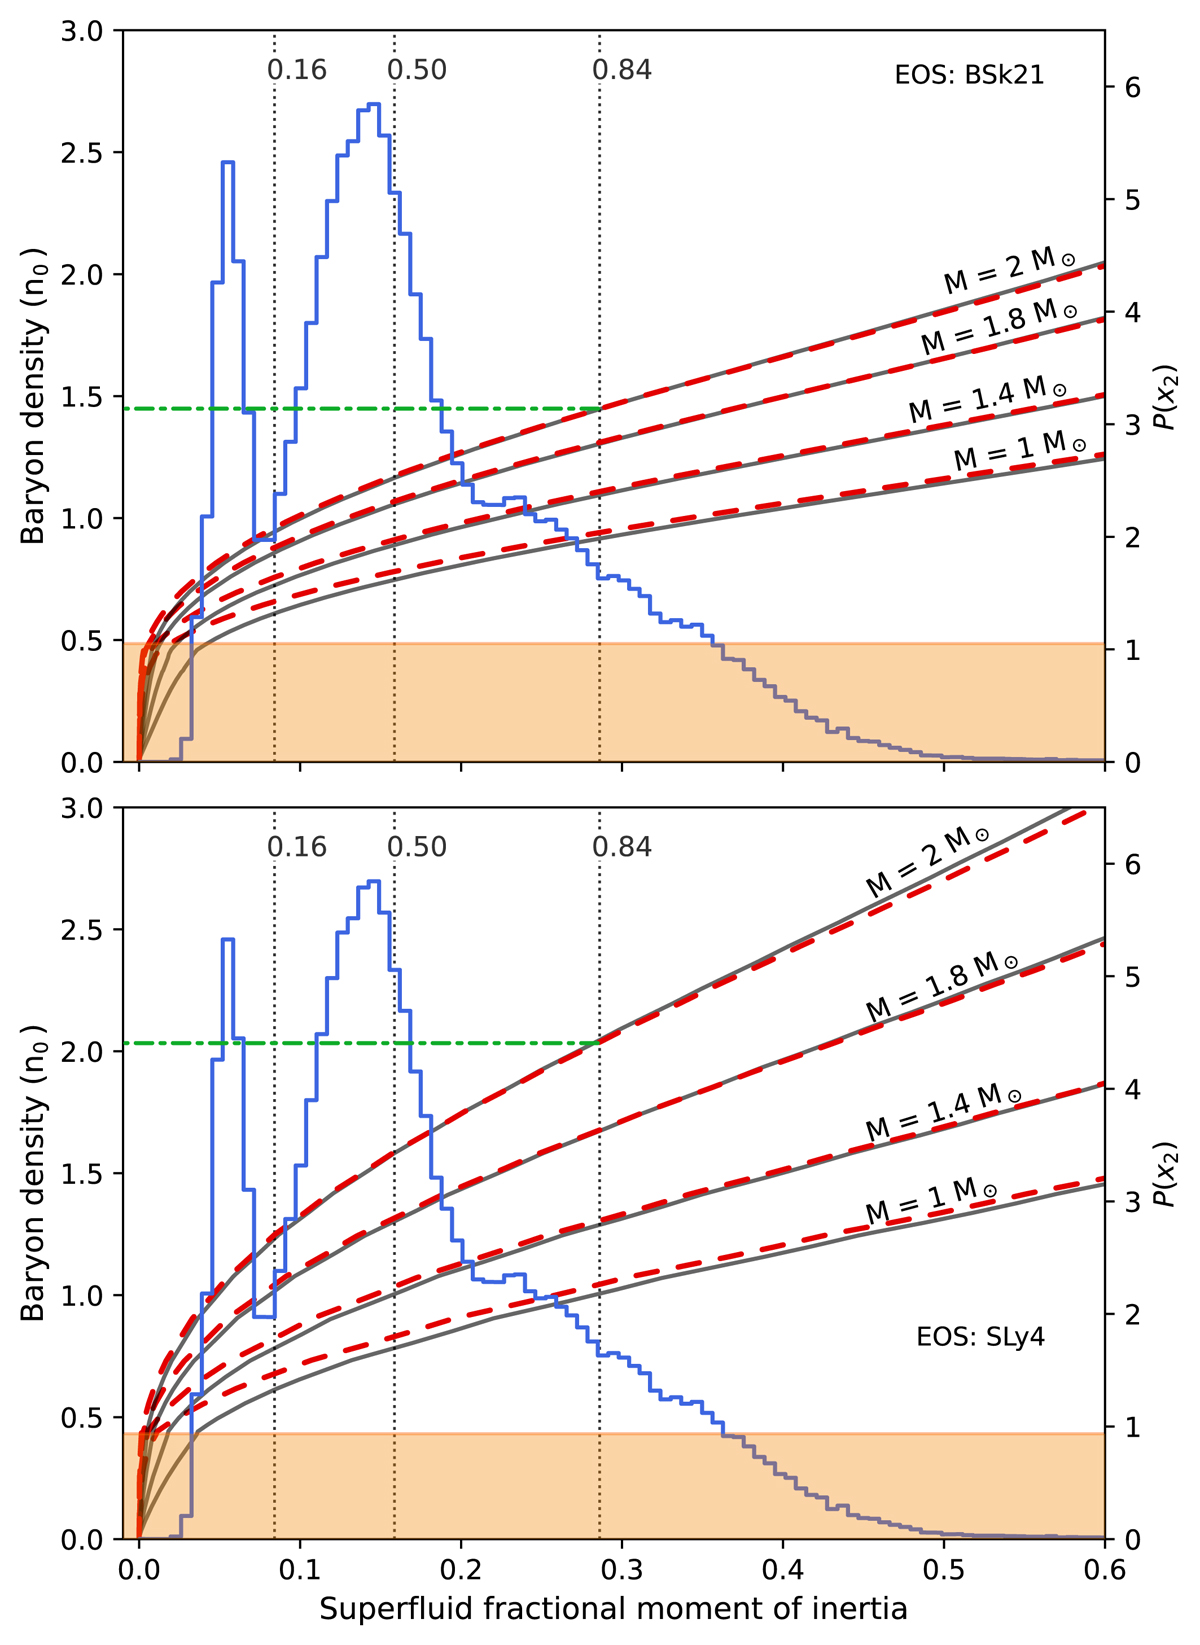
Comparison between the possible values of the superfluid moment of inertia fraction Iv(nB)/I and the possible values of x2 according to its posterior distribution P(x2). We plot the points (Iv(nB)/I, nB), where the baryon density nB is expressed in units of the nuclear saturation density n0 = 0.17 fm−3. The inner-crust, i.e. nd < nB ≲ 0.5n0, corresponds to the orange-shaded region. The upper panel refers to the BSk21 EoS (Goriely et al. 2010), the lower one to the SLy4 EoS (Douchin & Haensel 2001). The curves represent the points (Iv(nB)/I, nB) when entrainment corrections are included (red-dashed) by using the values calculated by Chamel & Haensel (2006) and Chamel (2012) and when entrainment coupling is set to zero (gray-solid). The posterior P(x2) is superimposed as a background histogram, with the 16th, 50th and 84th percentiles shown with black dotted lines. The two green dash-dotted lines indicate an upper limit (corresponding to the 84th percentile) to the extension of the superfluid 2 region if the mass of the Vela is M = 2M⊙.
Current usage metrics show cumulative count of Article Views (full-text article views including HTML views, PDF and ePub downloads, according to the available data) and Abstracts Views on Vision4Press platform.
Data correspond to usage on the plateform after 2015. The current usage metrics is available 48-96 hours after online publication and is updated daily on week days.
Initial download of the metrics may take a while.