Fig. 3.
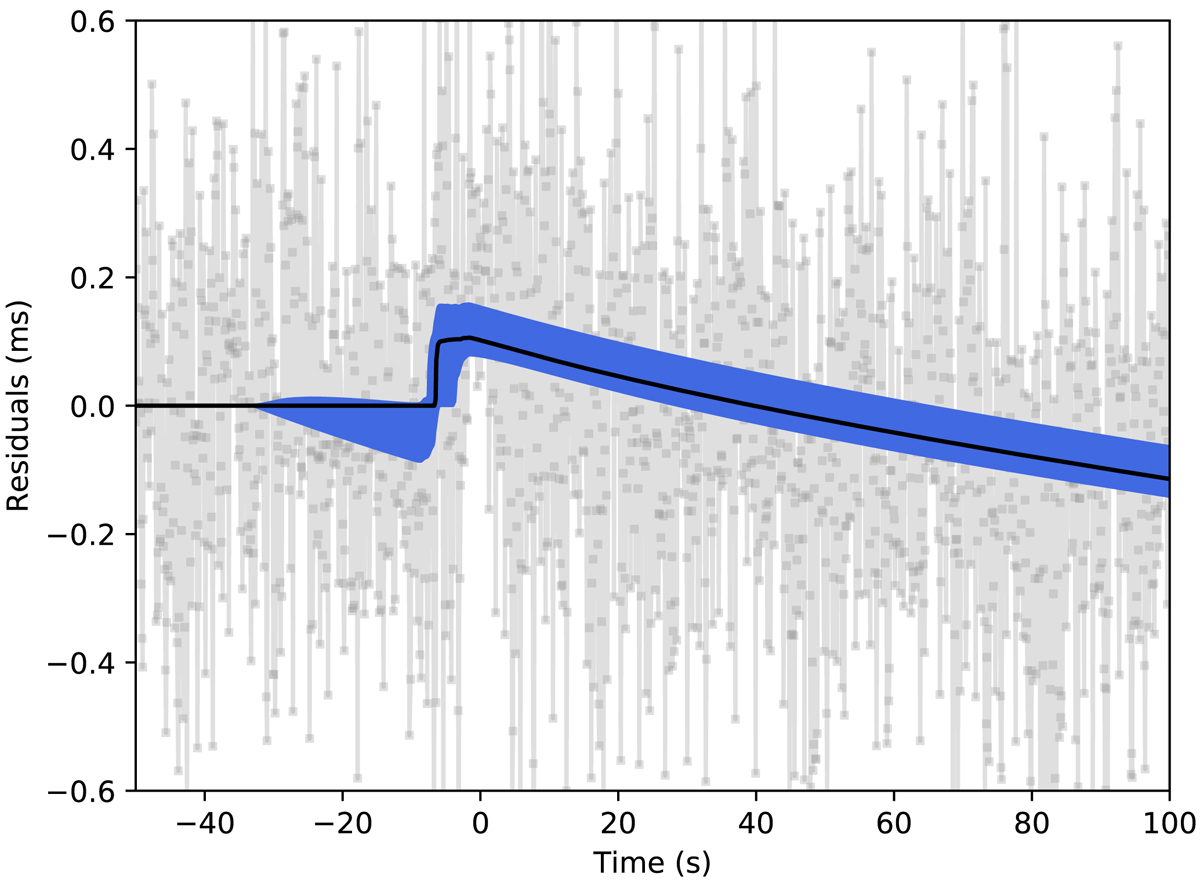
Result of the fit. We plot the data obtained by Palfreyman et al. (2018) in grey, joined by a line, and the fitted curve: for each time t every 0.1 s between −50 s and 100 s, we calculate the probability distribution for r(t) starting from the samples of the posterior distribution. The median of the probability distribution for the residual function r(t) defined in (11) is plotted in black, while the blue region indicates the 16th–84th percentile zone. The reference time t = 0 is set to be the glitch time ![]() calculated in Palfreyman et al. (2018).
calculated in Palfreyman et al. (2018).
Current usage metrics show cumulative count of Article Views (full-text article views including HTML views, PDF and ePub downloads, according to the available data) and Abstracts Views on Vision4Press platform.
Data correspond to usage on the plateform after 2015. The current usage metrics is available 48-96 hours after online publication and is updated daily on week days.
Initial download of the metrics may take a while.