Fig. 2.
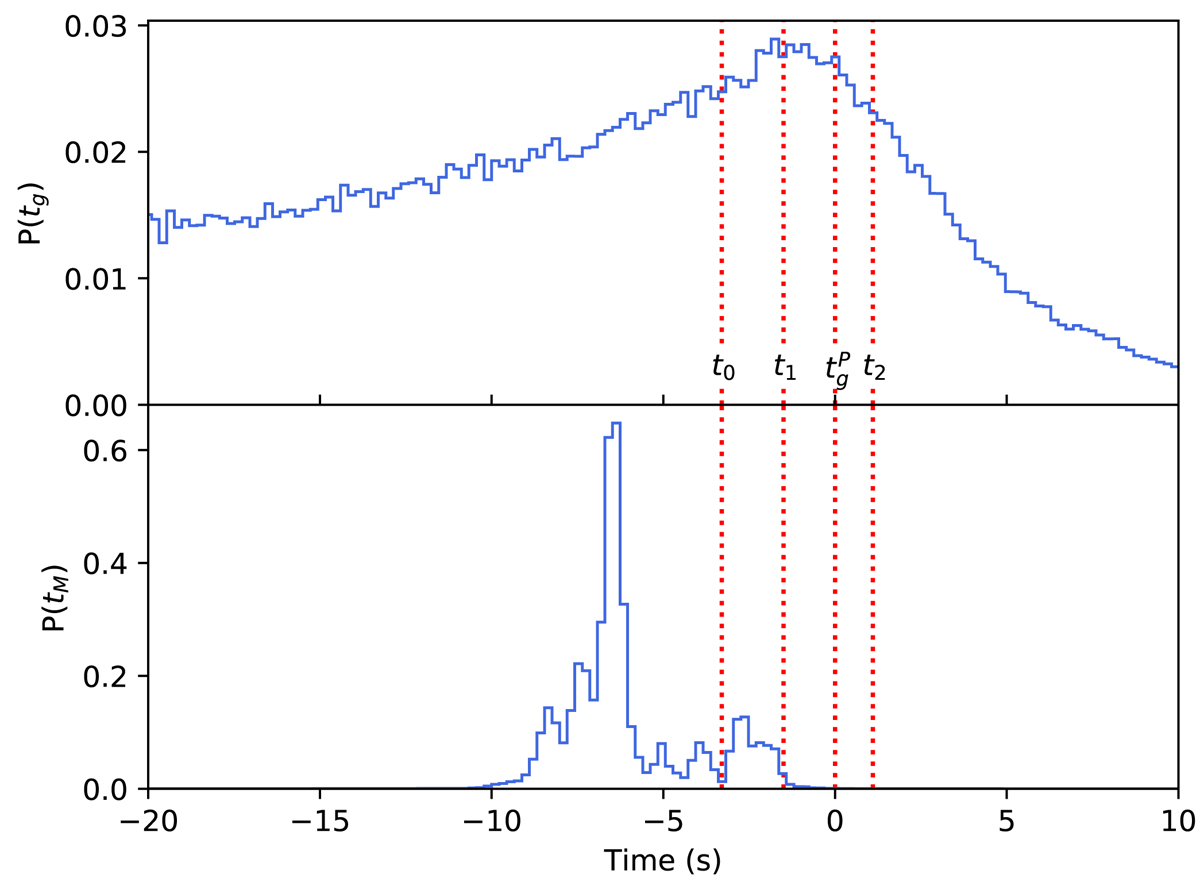
Probability distribution for the inferred glitch time tg and the time of the magnetospheric slip tM. For comparison, some characteristic times obtained in Palfreyman et al. (2018) are superimposed: the time of a null pulse t0, the start and the end of the rise of the residuals t1 and t2, and the glitch time ![]() as calculated in that paper.
as calculated in that paper.
Current usage metrics show cumulative count of Article Views (full-text article views including HTML views, PDF and ePub downloads, according to the available data) and Abstracts Views on Vision4Press platform.
Data correspond to usage on the plateform after 2015. The current usage metrics is available 48-96 hours after online publication and is updated daily on week days.
Initial download of the metrics may take a while.