Fig. 1.
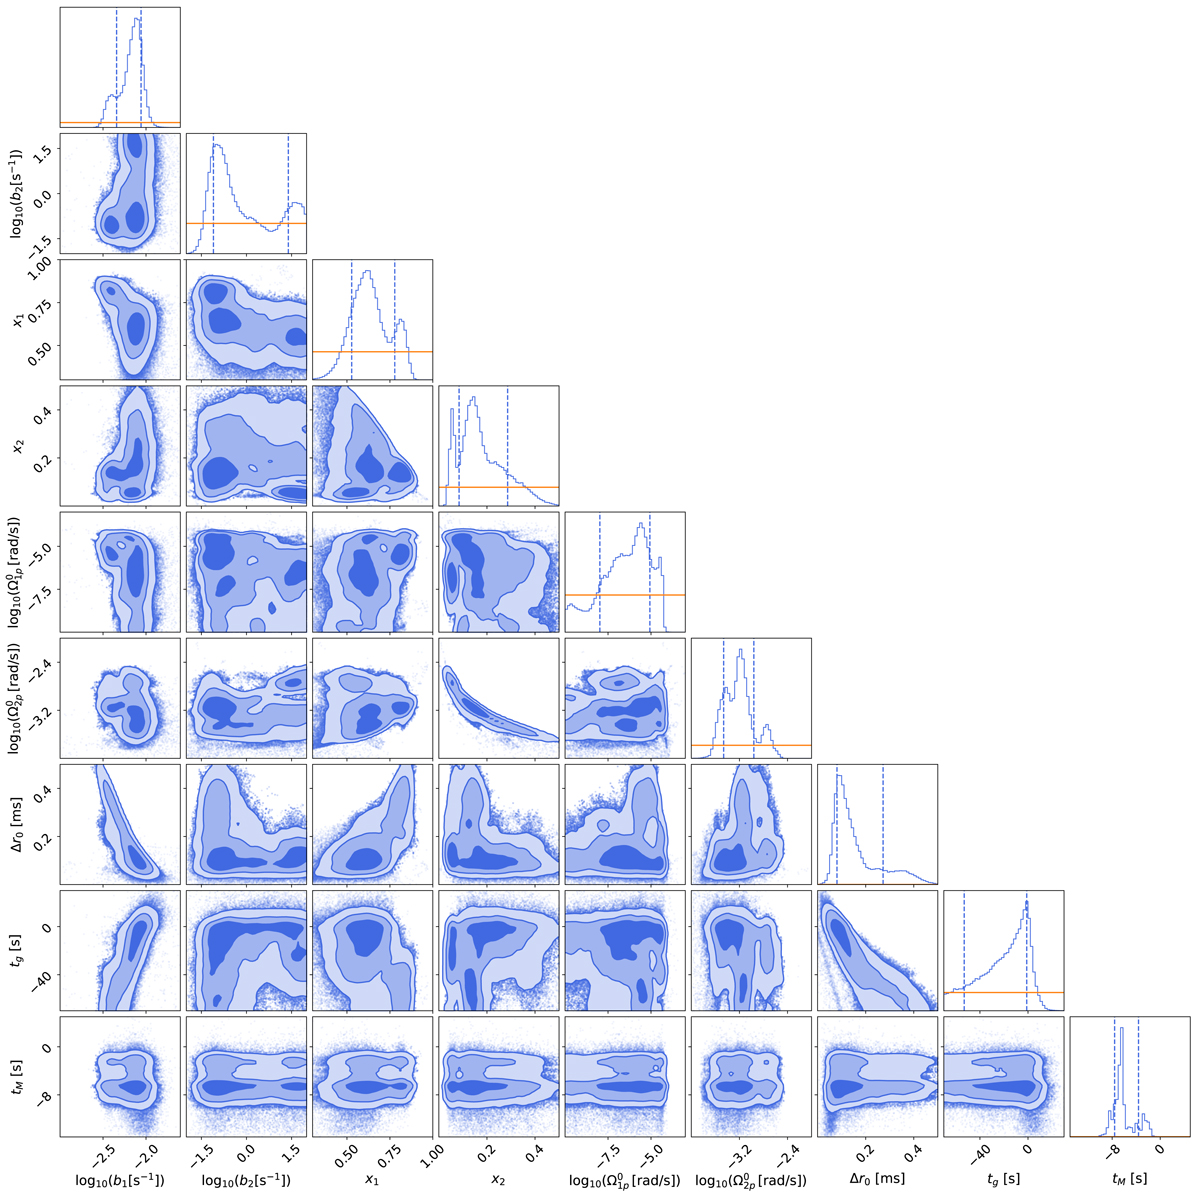
Cornerplot of the posterior distribution. On the diagonal, the marginalised posterior distribution for each parameter of the model is plotted. The vertical lines represent the 16th and 84th percentiles of these distributions. The numerical values are reported in Table 1. The prior distribution is plotted in orange as a comparison: for the jump in the residuals Δr0 and the magnetospheric time tM this is almost invisible, due to the width of the distribution. The covariance plots are located off-diagonal.
Current usage metrics show cumulative count of Article Views (full-text article views including HTML views, PDF and ePub downloads, according to the available data) and Abstracts Views on Vision4Press platform.
Data correspond to usage on the plateform after 2015. The current usage metrics is available 48-96 hours after online publication and is updated daily on week days.
Initial download of the metrics may take a while.