Fig. 9
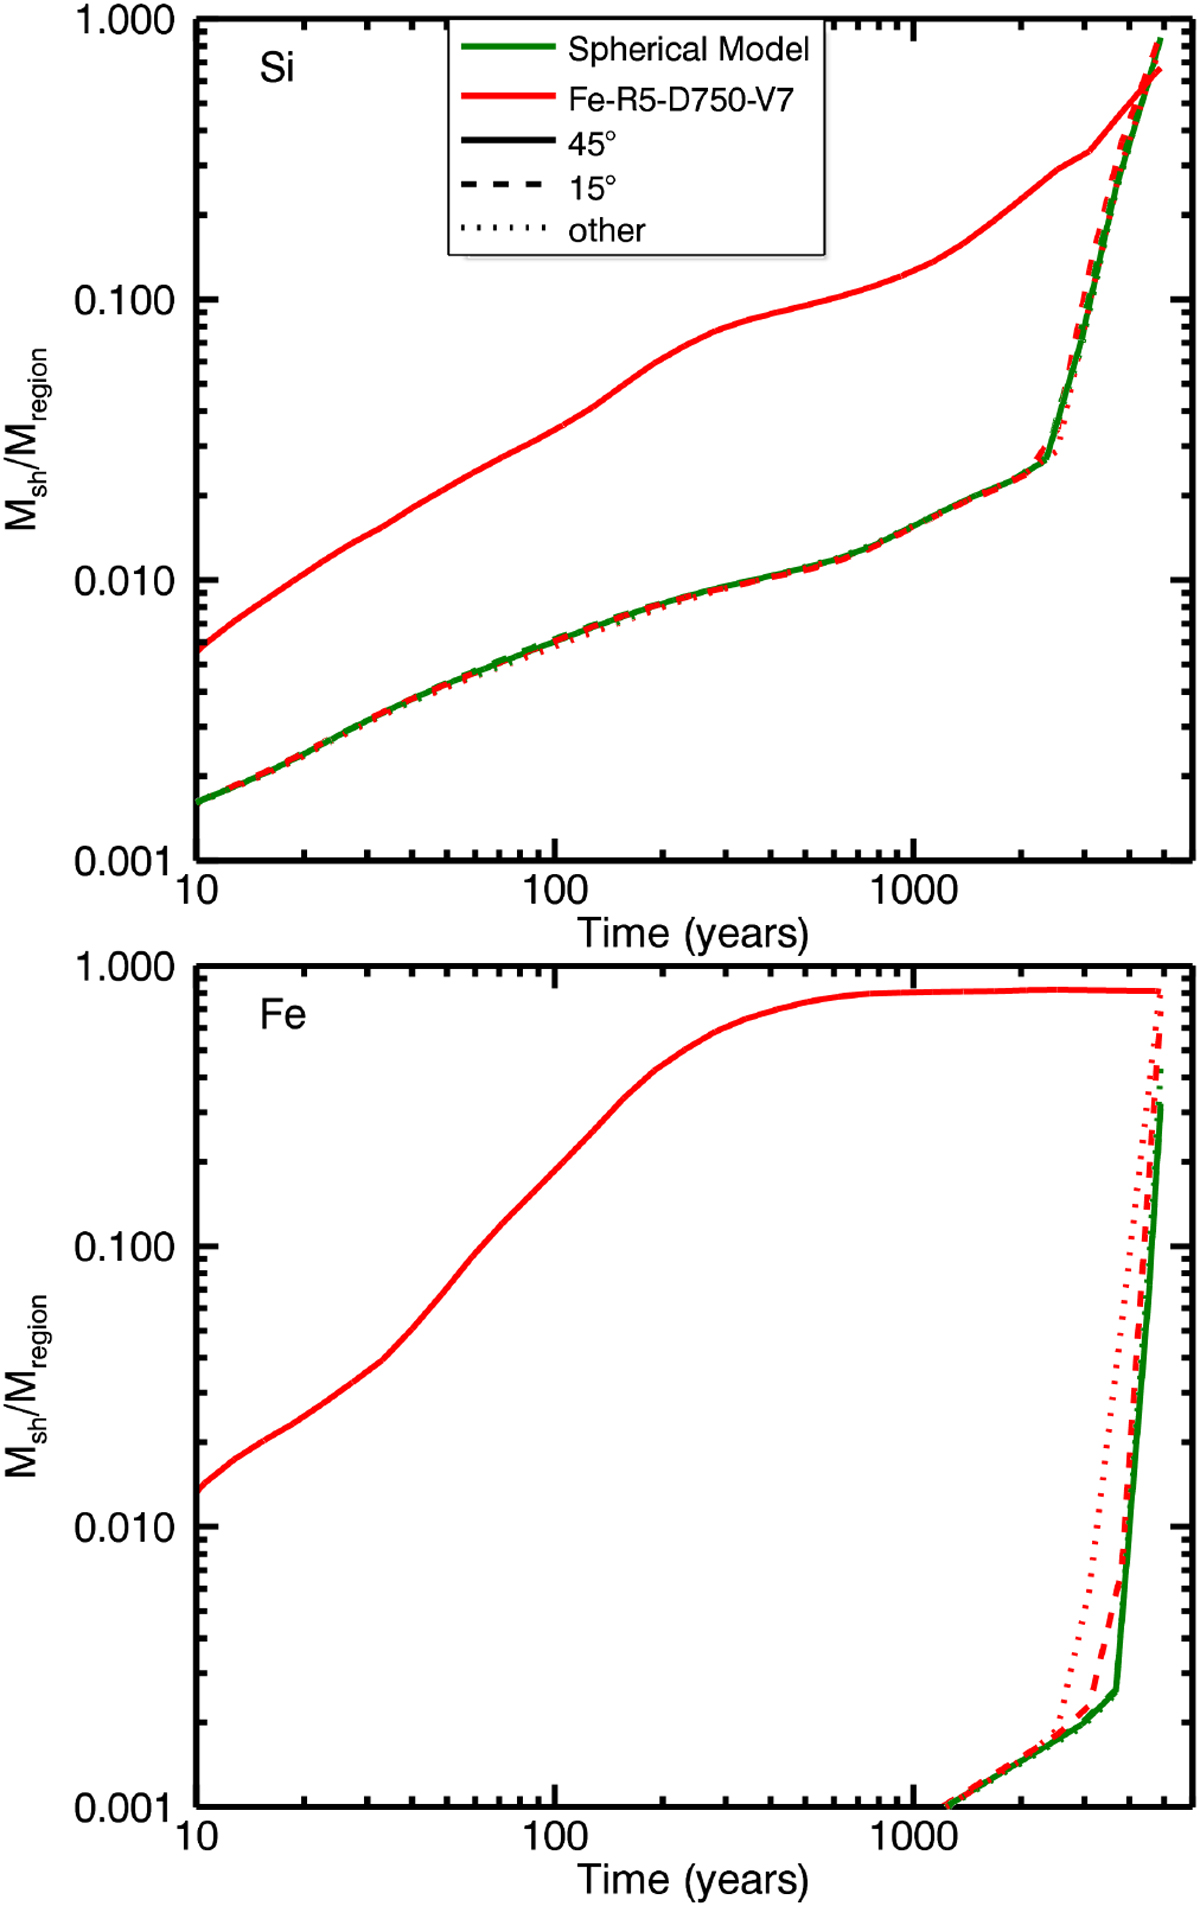
Mass of shocked 28Si (upper panel) and 56Fe (lower panel) vs. time for the spherically symmetric explosion (green lines) and for model Fe-R5-D750-V7 (red lines, see Table 1). Solid and dashed lines show the shocked mass from cells within 45° of the z-axis and from 15° of the equatorial plane respectively, while the dotted lines show the mass from the others cells. The shocked mass is normalized to the total mass of the relative element in the region considered.
Current usage metrics show cumulative count of Article Views (full-text article views including HTML views, PDF and ePub downloads, according to the available data) and Abstracts Views on Vision4Press platform.
Data correspond to usage on the plateform after 2015. The current usage metrics is available 48-96 hours after online publication and is updated daily on week days.
Initial download of the metrics may take a while.