Fig. 3
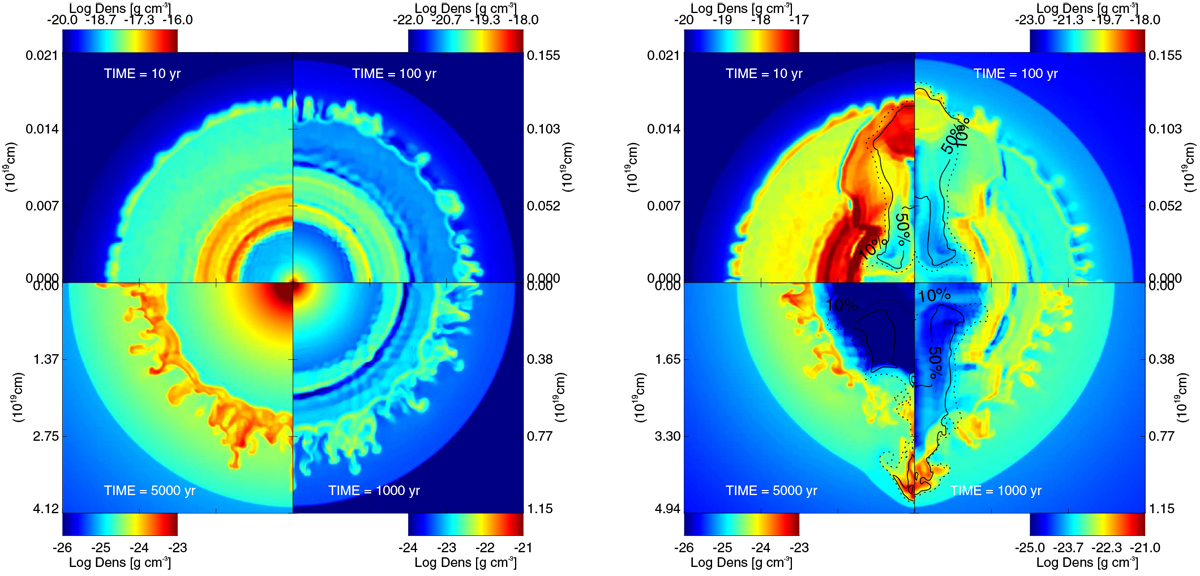
Density distributions in the (x, 0, z) plane at different simulation times for a spherically symmetric explosion (left panel) and for model Fe-R5-D750-V6 of Table 1 (right panel). From top left clockwise: t = 10, t = 100, t = 1000 and t = 5000 yr from the explosion. The units in the color bars are g cm−3 logarithmically scaled. The color-coded density scale is shown close to each quadrant. We highlight the different scales used in each quadrant for both the density and the distance along the axis. Right panel: the contours enclose the computational cells consisting of the original anisotropy material by more than 50% (solid line) and 10% (dotted line). See also online Movie 1 and 2 for an animated version.
Current usage metrics show cumulative count of Article Views (full-text article views including HTML views, PDF and ePub downloads, according to the available data) and Abstracts Views on Vision4Press platform.
Data correspond to usage on the plateform after 2015. The current usage metrics is available 48-96 hours after online publication and is updated daily on week days.
Initial download of the metrics may take a while.