Fig. 2
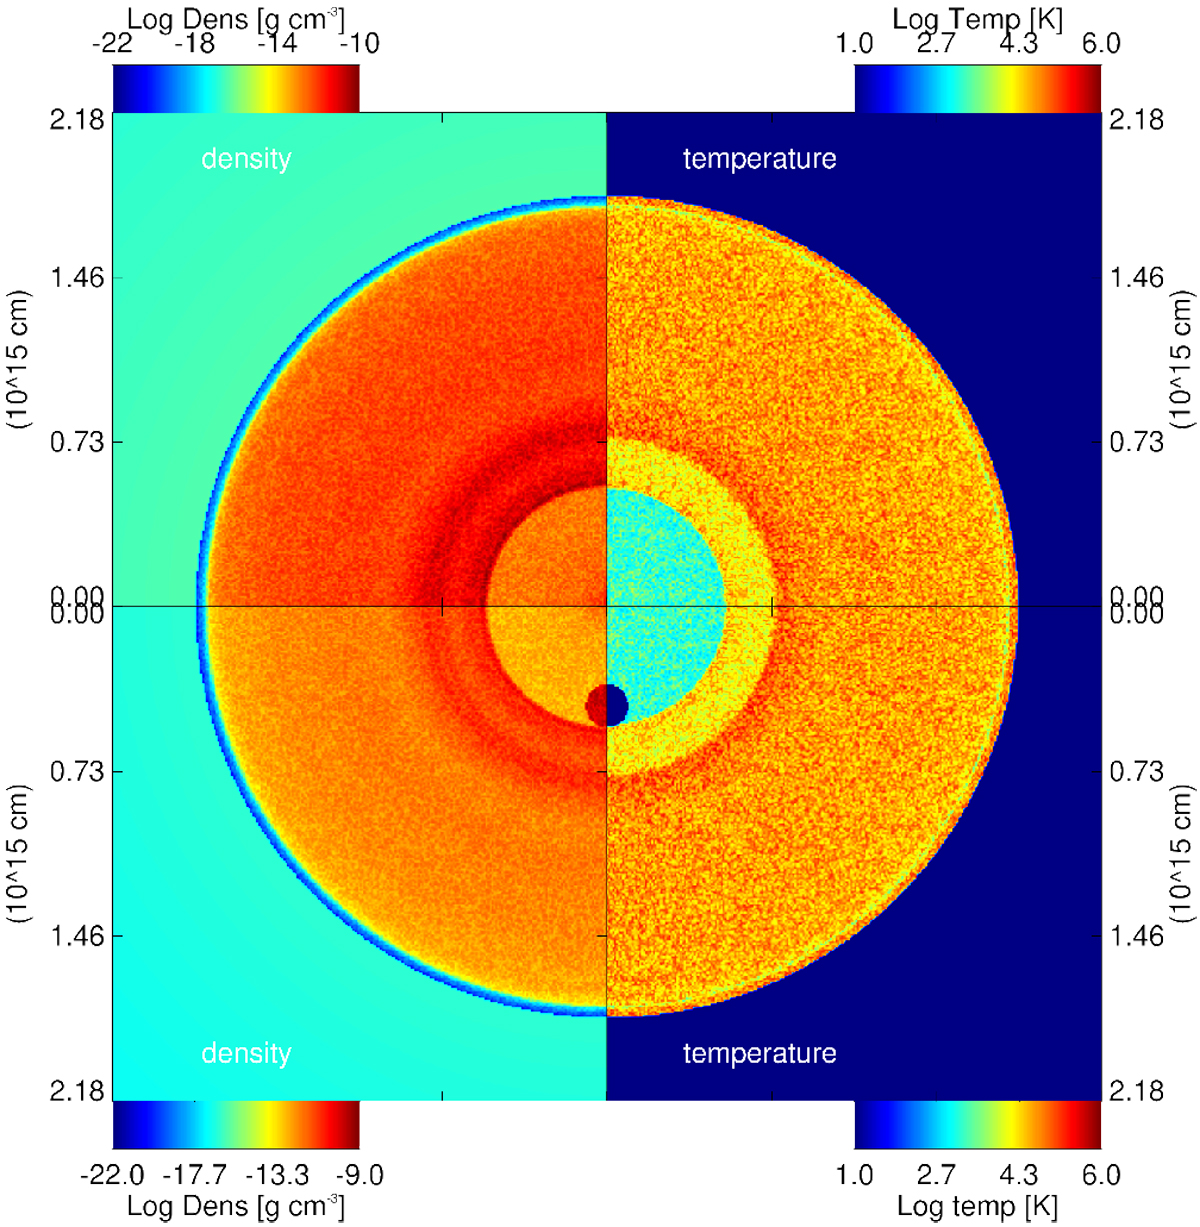
Density (left-hand quadrants) and temperature (right-hand quadrants) sections (x, 0, z) showing examples of the initial conditions. The values are color coded according to the scale shown for each quadrant. Upper quadrants show the case of a spherically symmetric explosion, and lower quadrants show a case with a dense, isobaric spherical anisotropy (namely run Si-R5-D750-V5 in Table 1).
Current usage metrics show cumulative count of Article Views (full-text article views including HTML views, PDF and ePub downloads, according to the available data) and Abstracts Views on Vision4Press platform.
Data correspond to usage on the plateform after 2015. The current usage metrics is available 48-96 hours after online publication and is updated daily on week days.
Initial download of the metrics may take a while.