Free Access
Fig. B.2
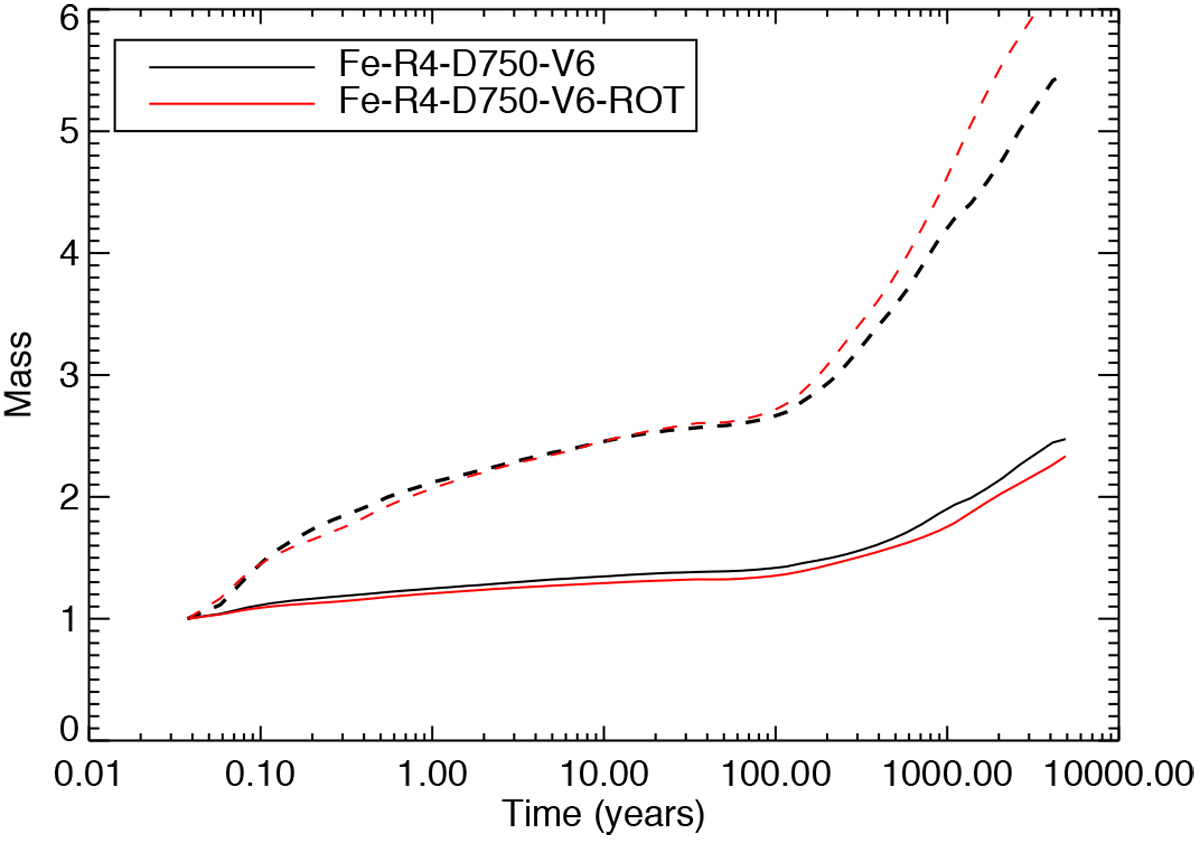
Mass vs. time (in logarithmic scale) for the two models compared in Fig. B.1. Total mass in cells with anisotropy material by more than 10% (continuous line) and in the range 10–90% (dotted line). In every case the mass is normalized to the value of the mass in the first step of the simulation.
Current usage metrics show cumulative count of Article Views (full-text article views including HTML views, PDF and ePub downloads, according to the available data) and Abstracts Views on Vision4Press platform.
Data correspond to usage on the plateform after 2015. The current usage metrics is available 48-96 hours after online publication and is updated daily on week days.
Initial download of the metrics may take a while.