Fig. A.1
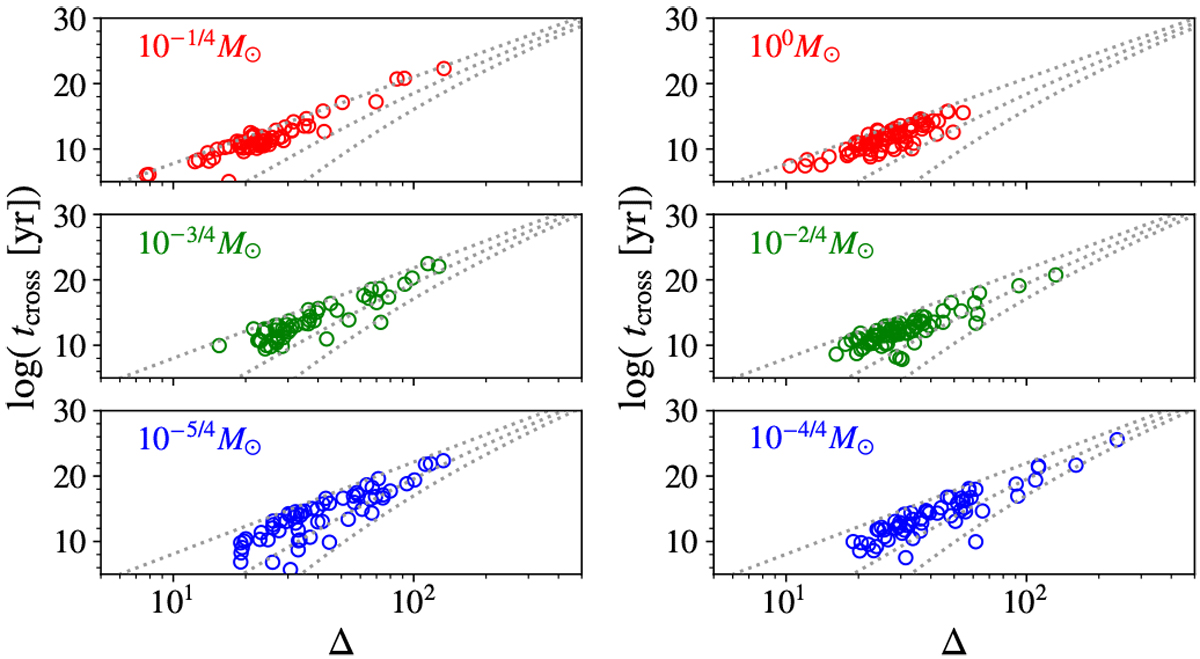
Orbital crossing time (tcross) of each planet pair is plotted as a function of the orbital separation in the mutual Hill radius (Δ). Left panels: results in the massive series (models Ms1Σ100b10, Ms3Σ30b10, and Ms5Σ10b10), and right: those in the less-massive series (models Ms0Σ100b10, Ms2Σ30b10, and Ms4Σ10b10), respectively. Three dotted lines are the orbital crossing time with e = 0 planets (left one), 0.5eesc,M1 planets (middle one), and eesc,M1 planets (right one) estimated by Eq. (A.1).
Current usage metrics show cumulative count of Article Views (full-text article views including HTML views, PDF and ePub downloads, according to the available data) and Abstracts Views on Vision4Press platform.
Data correspond to usage on the plateform after 2015. The current usage metrics is available 48-96 hours after online publication and is updated daily on week days.
Initial download of the metrics may take a while.