Fig. 5
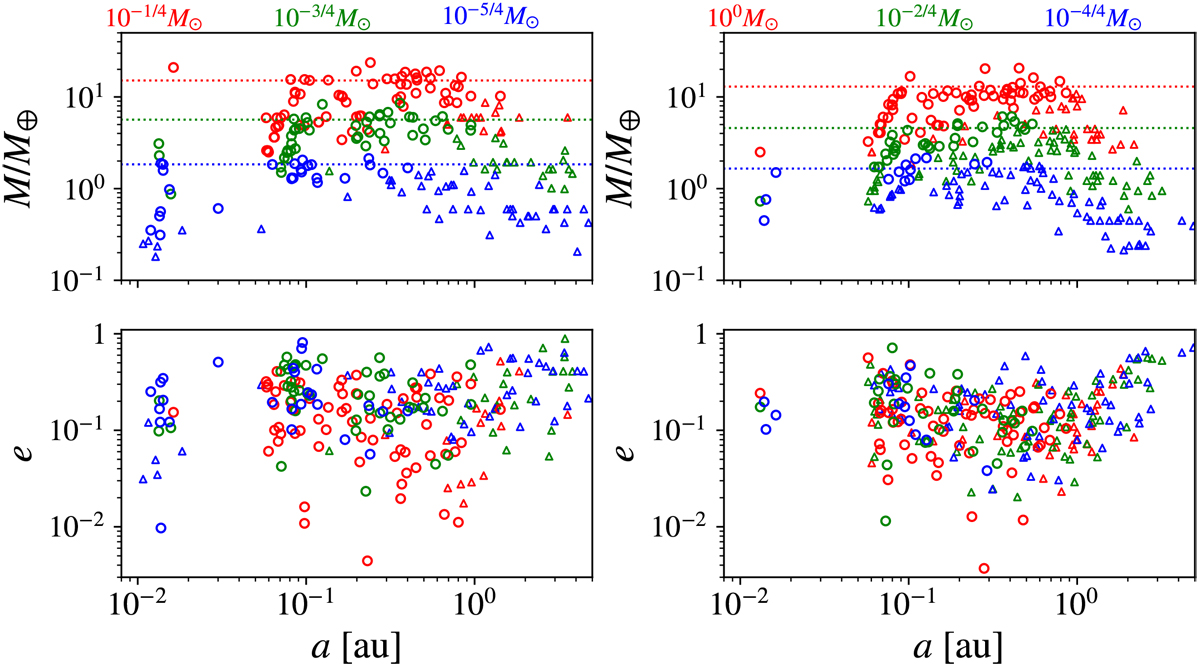
Snapshots of the final planets plotted on the a−M (top) and a−e (bottom) planes. The planets, which are represented by circles and triangles, have larger and smaller radial velocity amplitudes than 1 m s−1, respectively. The dotted lines in the top panels are given by Eq. (5) for M1 ∕ M⊕. Left panels: we plotted the results of the massive series, which include models Ms1Σ100b10 (red symbols), Ms3Σ30b10 (green ones),and Ms5Σ10b10 (blue ones). Right panels: we plotted the results of the less-massive series, which are models Ms0Σ100b10 (red symbols), Ms2Σ30b10 (green ones),and Ms4Σ10b10 (blue ones).
Current usage metrics show cumulative count of Article Views (full-text article views including HTML views, PDF and ePub downloads, according to the available data) and Abstracts Views on Vision4Press platform.
Data correspond to usage on the plateform after 2015. The current usage metrics is available 48-96 hours after online publication and is updated daily on week days.
Initial download of the metrics may take a while.