Fig. 3
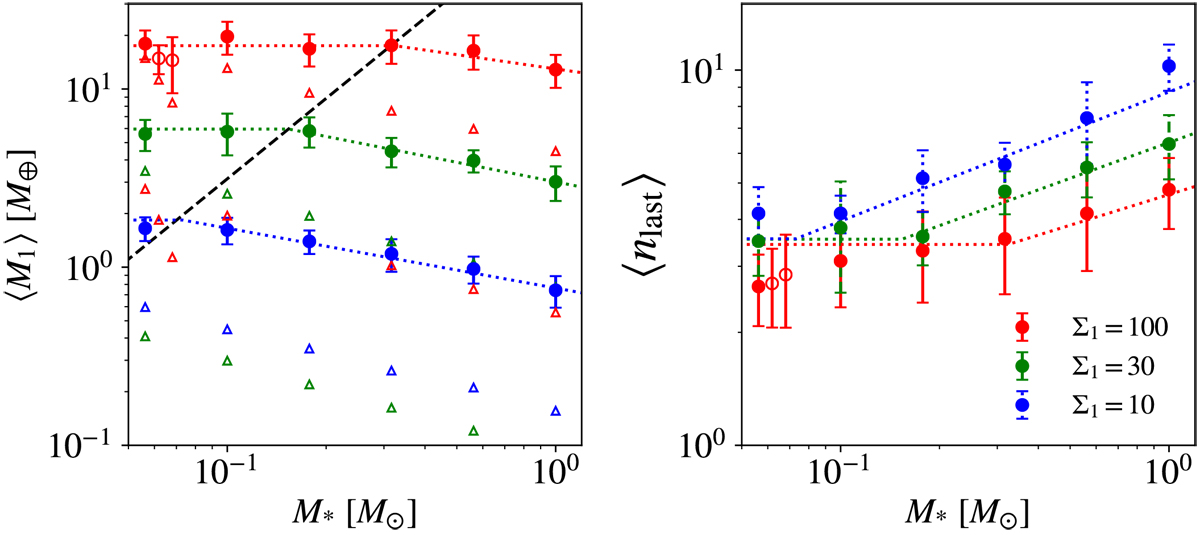
Average values of the most massive planets (⟨M1⟩) and the number of planets (⟨nlast⟩) in a system are shown as a function of the stellar mass. The length of the error bars is equal to the standard deviation. We plotted the results of Σ1 = 10 g cm−2 in blue filled symbols, Σ1 = 30 g cm−2 in green filled ones, and Σ1 = 100 g cm−2 in red filled ones. The open circles are the results of models Ms5Σ100b8 (left) and Ms5Σ100b6 (right), which are plotted at slightly large M* to avoid overlapping. Left panel: dashed line is the ejection mass (Mej) given by Eq". (4). The triangles are the mass of the largest and smallest initial protoplanets. The dotted lines are the fitting lines. In the collision-dominated regime (⟨M1 ⟩ < Mej), we derived the fitting lines from the mass of the most massive planets and the final number of planets in all of the simulation results. In the ejection-dominated regime (⟨M1 ⟩ > Mej), these lines are constant and equal to those values at ⟨M1⟩ = Mej.
Current usage metrics show cumulative count of Article Views (full-text article views including HTML views, PDF and ePub downloads, according to the available data) and Abstracts Views on Vision4Press platform.
Data correspond to usage on the plateform after 2015. The current usage metrics is available 48-96 hours after online publication and is updated daily on week days.
Initial download of the metrics may take a while.