Fig. 1
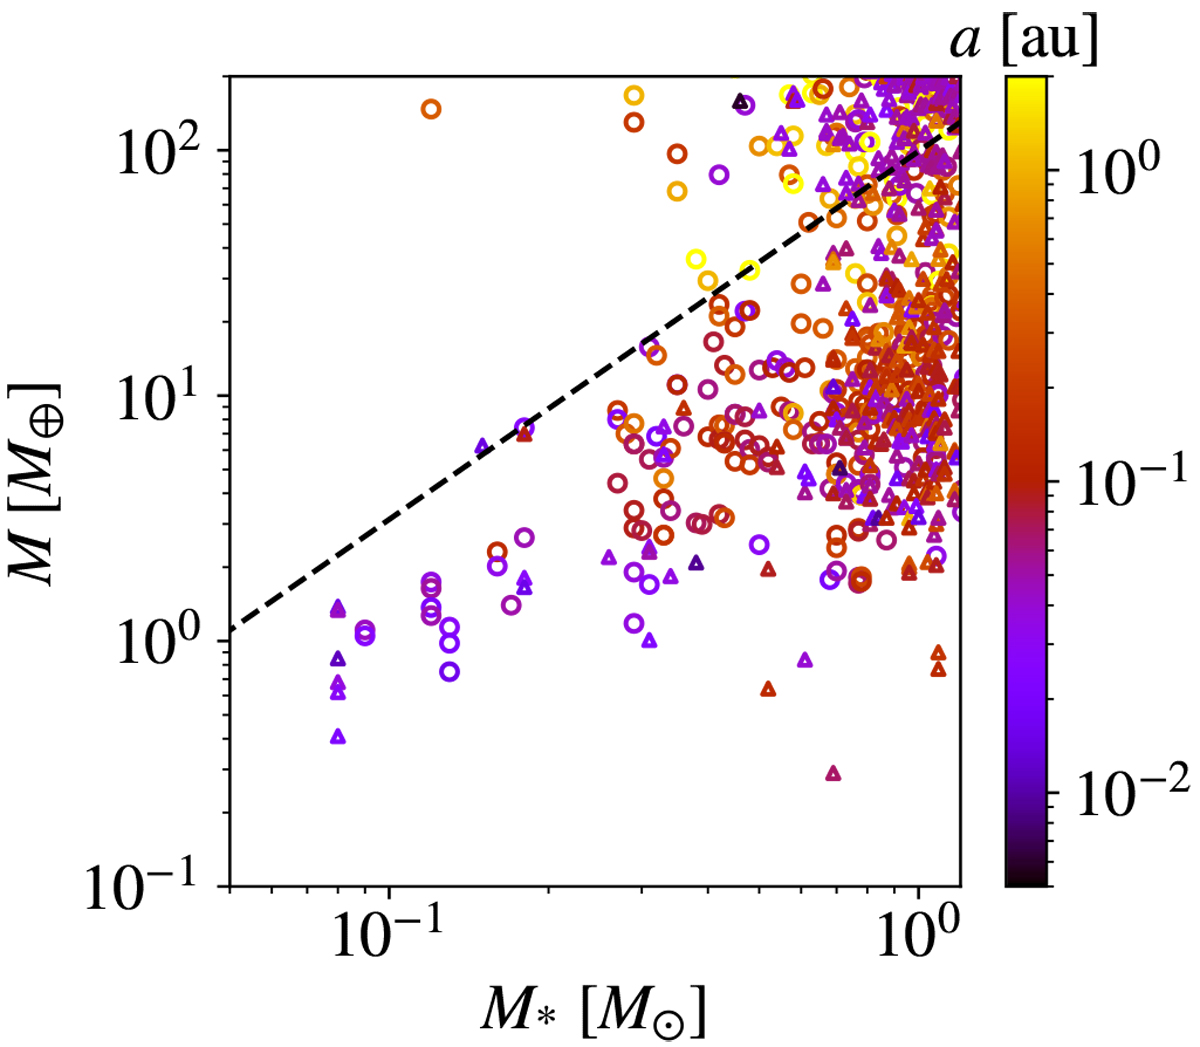
Distribution of observed planets on the stellar mass in the solar mass unit (M* [M⊙]) and planetary mass in the Earth mass unit (M [M⊕]) plane. The data were extracted from the NASA exoplanet archive (https://exoplanetarchive.ipac.caltech.edu/) as of April 2020. Point colors represent the semimajor axis of each planet. Planets shown in circles were detected by the radial velocity (RV) method and those in triangles were detected using the transit or transit timing methods. The dashed line is the ejection mass at 0.1 au, given by Eq. (4).
Current usage metrics show cumulative count of Article Views (full-text article views including HTML views, PDF and ePub downloads, according to the available data) and Abstracts Views on Vision4Press platform.
Data correspond to usage on the plateform after 2015. The current usage metrics is available 48-96 hours after online publication and is updated daily on week days.
Initial download of the metrics may take a while.