Open Access
Fig. 8.
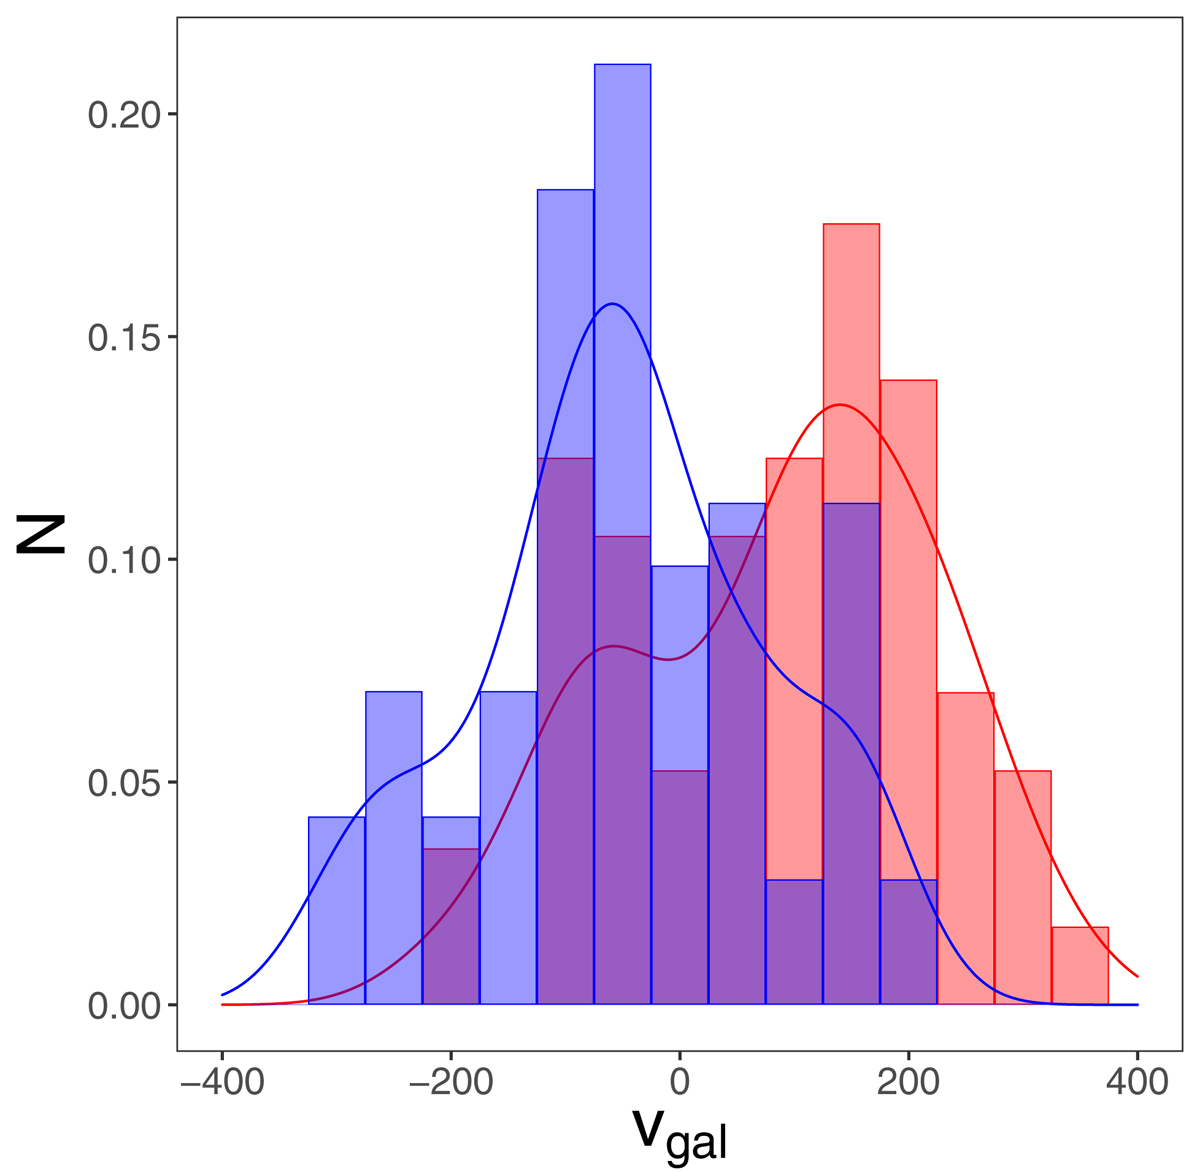
Normalized galactocentric velocity distributions for negative longitudes and positive longitudes (in red and blue, respectively) as in Schönrich et al. (2015). We limited our sample to |l|< 0.5° in order to account for the uneven sample distribution.
Current usage metrics show cumulative count of Article Views (full-text article views including HTML views, PDF and ePub downloads, according to the available data) and Abstracts Views on Vision4Press platform.
Data correspond to usage on the plateform after 2015. The current usage metrics is available 48-96 hours after online publication and is updated daily on week days.
Initial download of the metrics may take a while.