Fig. 2.
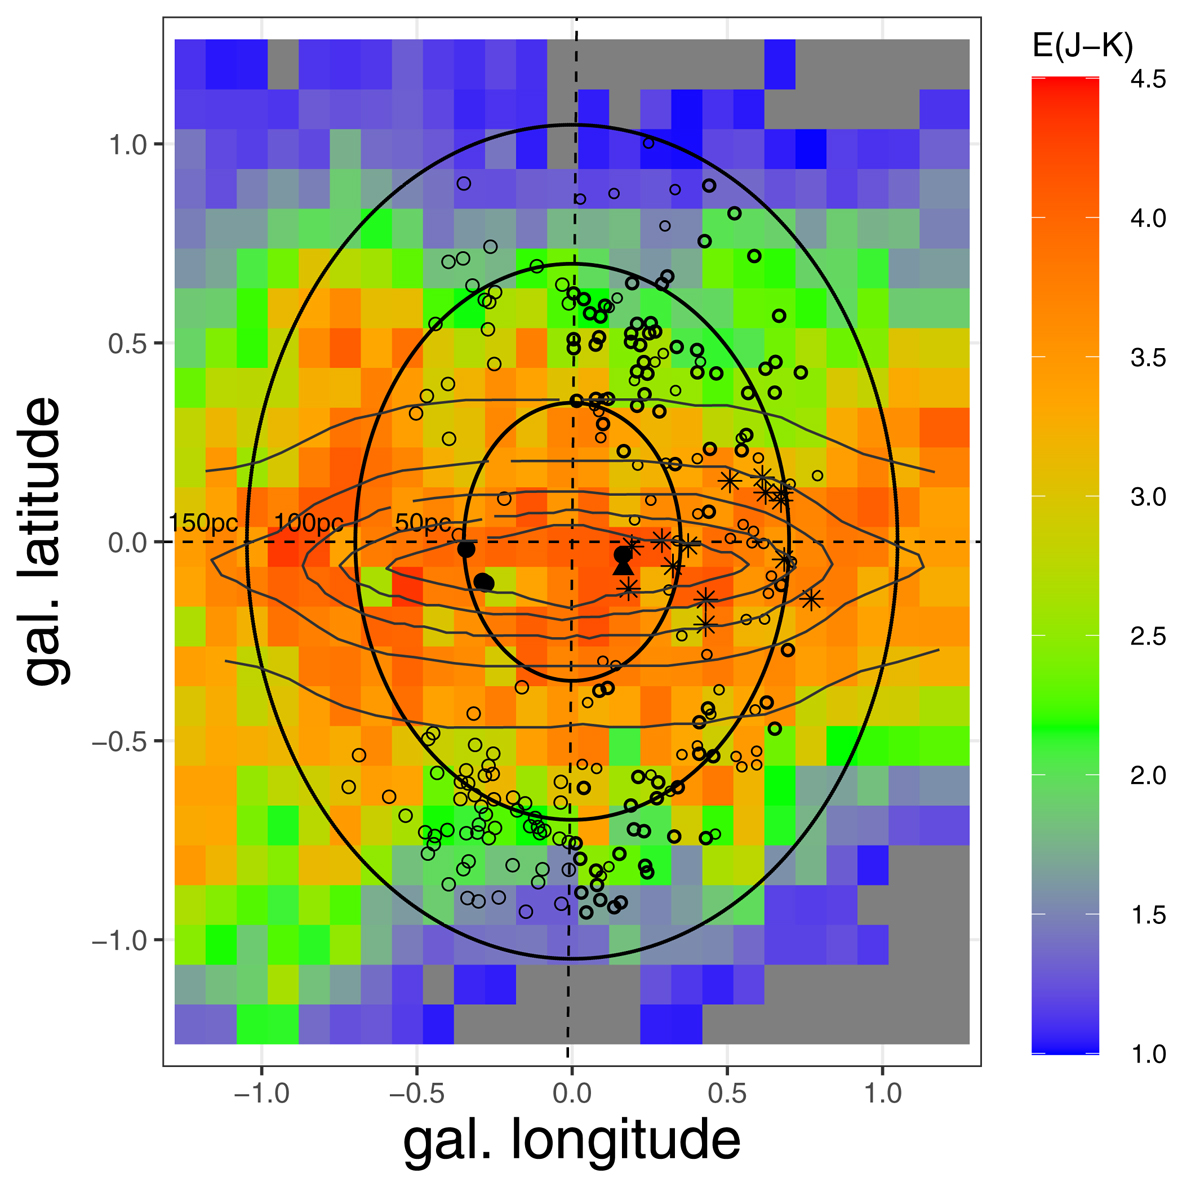
Galactic-longitude vs. Galactic-latitude distribution of the GALCEN sample superimposed on the interstellar extinction map of Gonzalez et al. (2012). The circles denote radii of 50 pc, 100 pc, and 150 pc assuming a distance to the GC of 8.2 kpc. Open circles denote M giant stars, the filled triangle is the supergiant VR 5-7, filled circles are AGB stars (see Table 1), and asterisks are supergiant candidates (see Table 2). The gray contours show the surface brightness map of the best fit model of the nuclear bulge component by Launhardt et al. (2002).
Current usage metrics show cumulative count of Article Views (full-text article views including HTML views, PDF and ePub downloads, according to the available data) and Abstracts Views on Vision4Press platform.
Data correspond to usage on the plateform after 2015. The current usage metrics is available 48-96 hours after online publication and is updated daily on week days.
Initial download of the metrics may take a while.