Free Access
Fig. G.1.
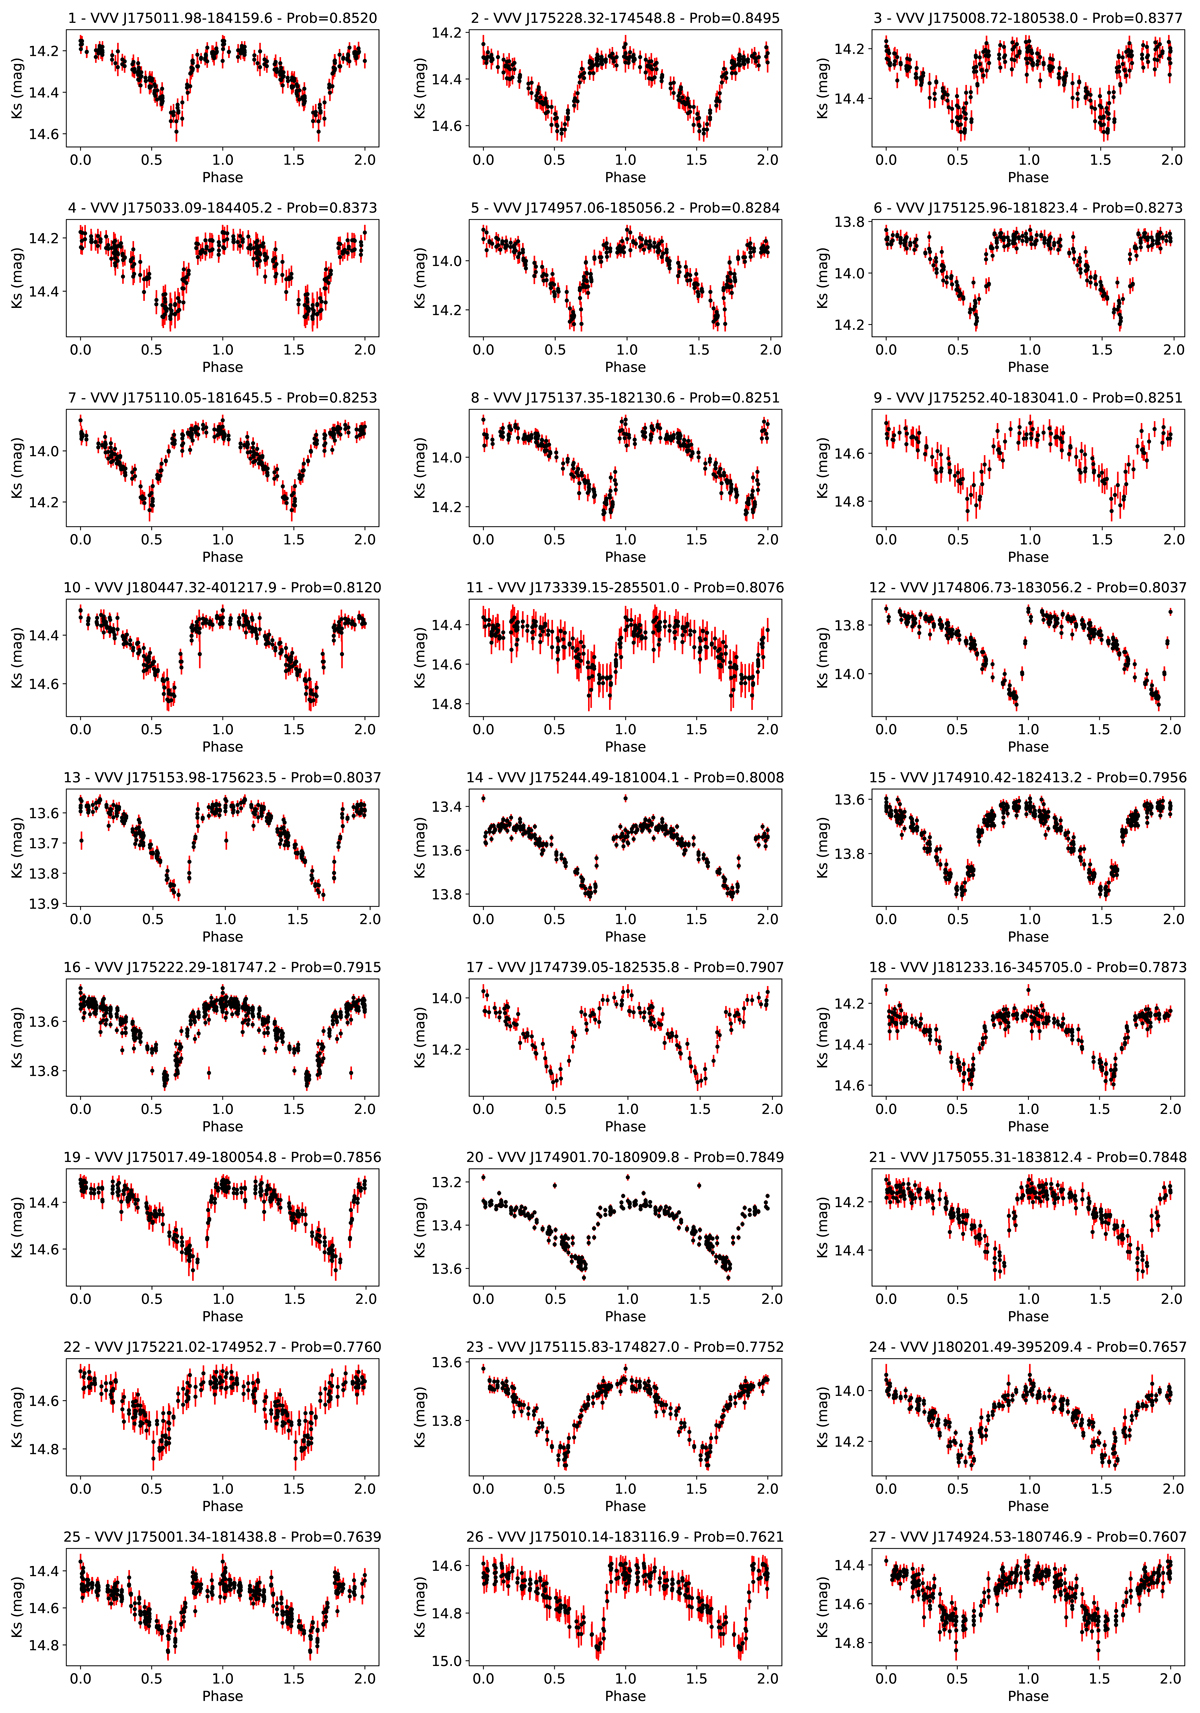
Folded light curve for the candidates 1–27 to RRL sorted by probability to be an RRL. In the title of every plot are displayed number of the source, the VVV identification and the probability to be a RRL. The horizontal axis is the phase, and the vertical shows the source magnitude. For visual ease, two periods are shown.
Current usage metrics show cumulative count of Article Views (full-text article views including HTML views, PDF and ePub downloads, according to the available data) and Abstracts Views on Vision4Press platform.
Data correspond to usage on the plateform after 2015. The current usage metrics is available 48-96 hours after online publication and is updated daily on week days.
Initial download of the metrics may take a while.