Fig. 12.
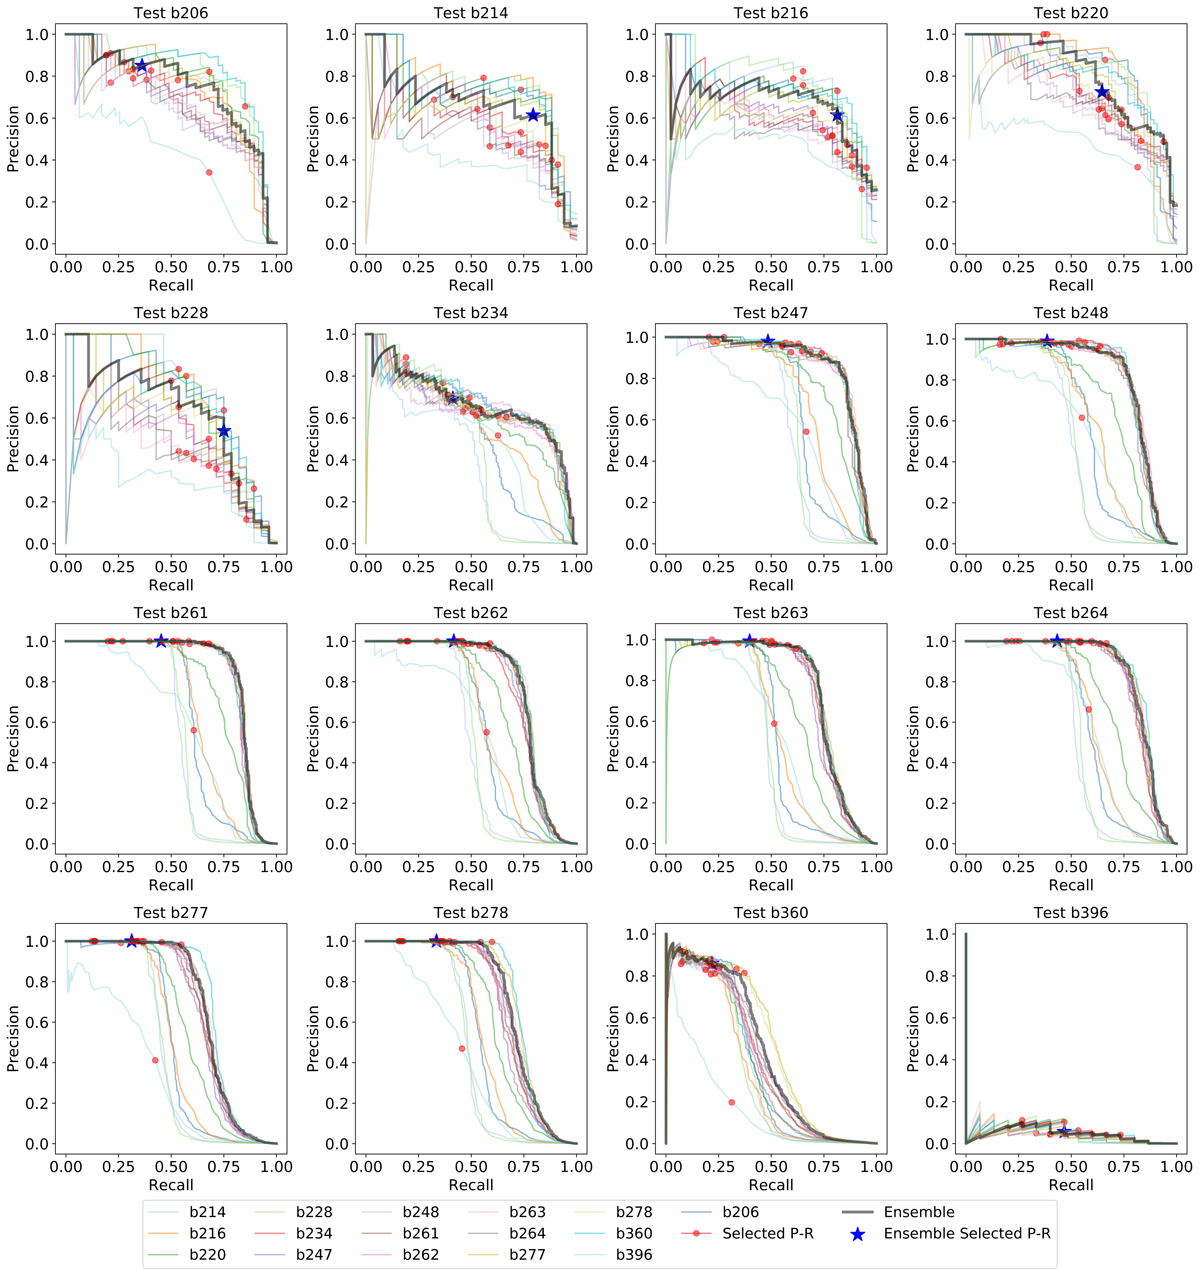
Precision vs. recall curves for the final classifiers on each test tile. In each panel, the colored curves represent a classifier trained with a tile, while the black curve is the ensemble classifier. Red dots correspond to a precision and recall fixed at a threshold equivalent to the recall ∼0.5 when training and testing on the same tile with 10 k-folds. The blue stars represent the working point selected by averaging the thresholds corresponding to the red points.
Current usage metrics show cumulative count of Article Views (full-text article views including HTML views, PDF and ePub downloads, according to the available data) and Abstracts Views on Vision4Press platform.
Data correspond to usage on the plateform after 2015. The current usage metrics is available 48-96 hours after online publication and is updated daily on week days.
Initial download of the metrics may take a while.