Fig. 11.
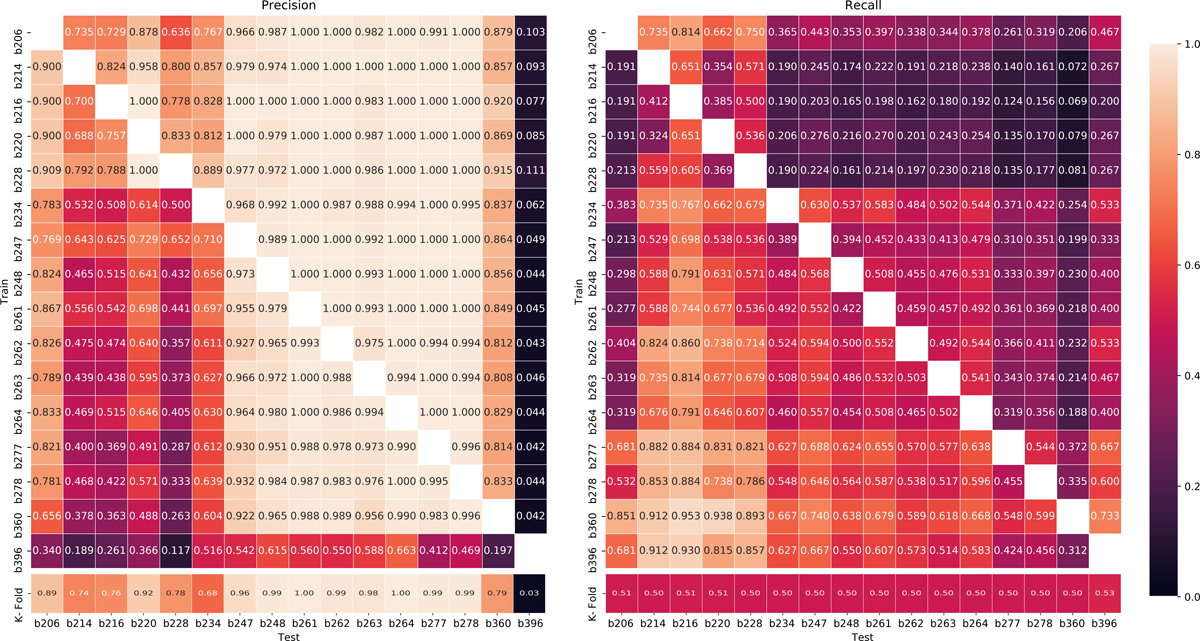
Tables of precision and recall, training and testing with complete data of the 16 tiles. The last (separated) row shows the estimated precision (left) achieved by selecting a threshold value that sets the recall to ∼0.5 (right), training and testing on each tile with a 10 K-Folds procedure. The upper rows shows the recall and precision values observed on the test set (columns) when training on diverse tiles (rows), using the thresholds selected by 10 K-Folds (used on the last row).
Current usage metrics show cumulative count of Article Views (full-text article views including HTML views, PDF and ePub downloads, according to the available data) and Abstracts Views on Vision4Press platform.
Data correspond to usage on the plateform after 2015. The current usage metrics is available 48-96 hours after online publication and is updated daily on week days.
Initial download of the metrics may take a while.