Fig. 9.
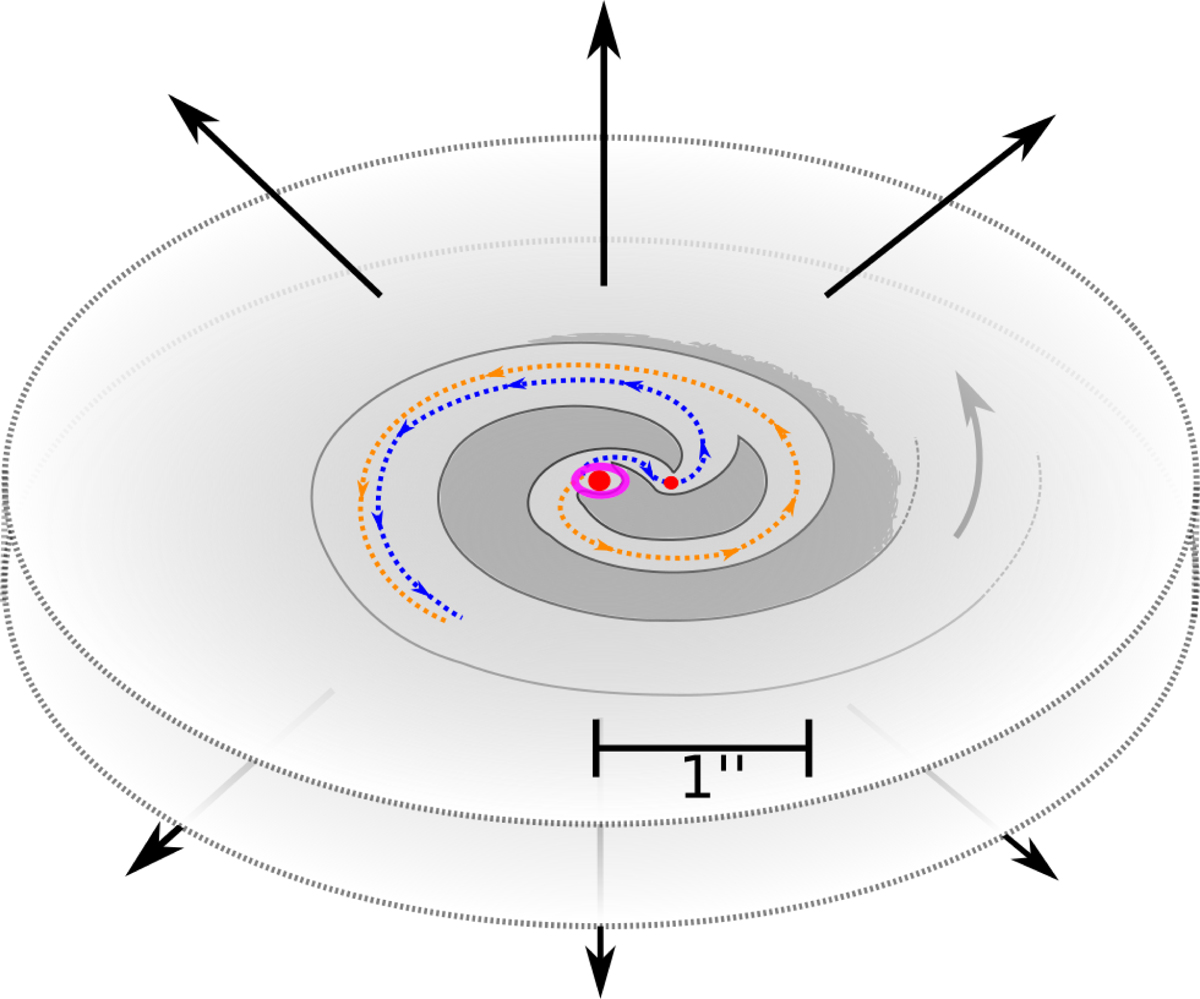
Schematic diagram of the wind-companion interaction zone. The two red dots represent the AGB star and the companion, separated by 0.4″. The pale outline in the central grey (less dense) zone represents the local density enhancement as a consequence of the interaction hydrodynamics. The blue (orange) dotted arrow line represents the flow along L1 (L3), which combine into the larger scale spiral observed in the EDE. The three arrows on top and bottom represent the (bi-conical) AGB outflow. We have indicated the dust ring observed with SPHERE/ZIMPOL in fuchsia.
Current usage metrics show cumulative count of Article Views (full-text article views including HTML views, PDF and ePub downloads, according to the available data) and Abstracts Views on Vision4Press platform.
Data correspond to usage on the plateform after 2015. The current usage metrics is available 48-96 hours after online publication and is updated daily on week days.
Initial download of the metrics may take a while.