Fig. 8.
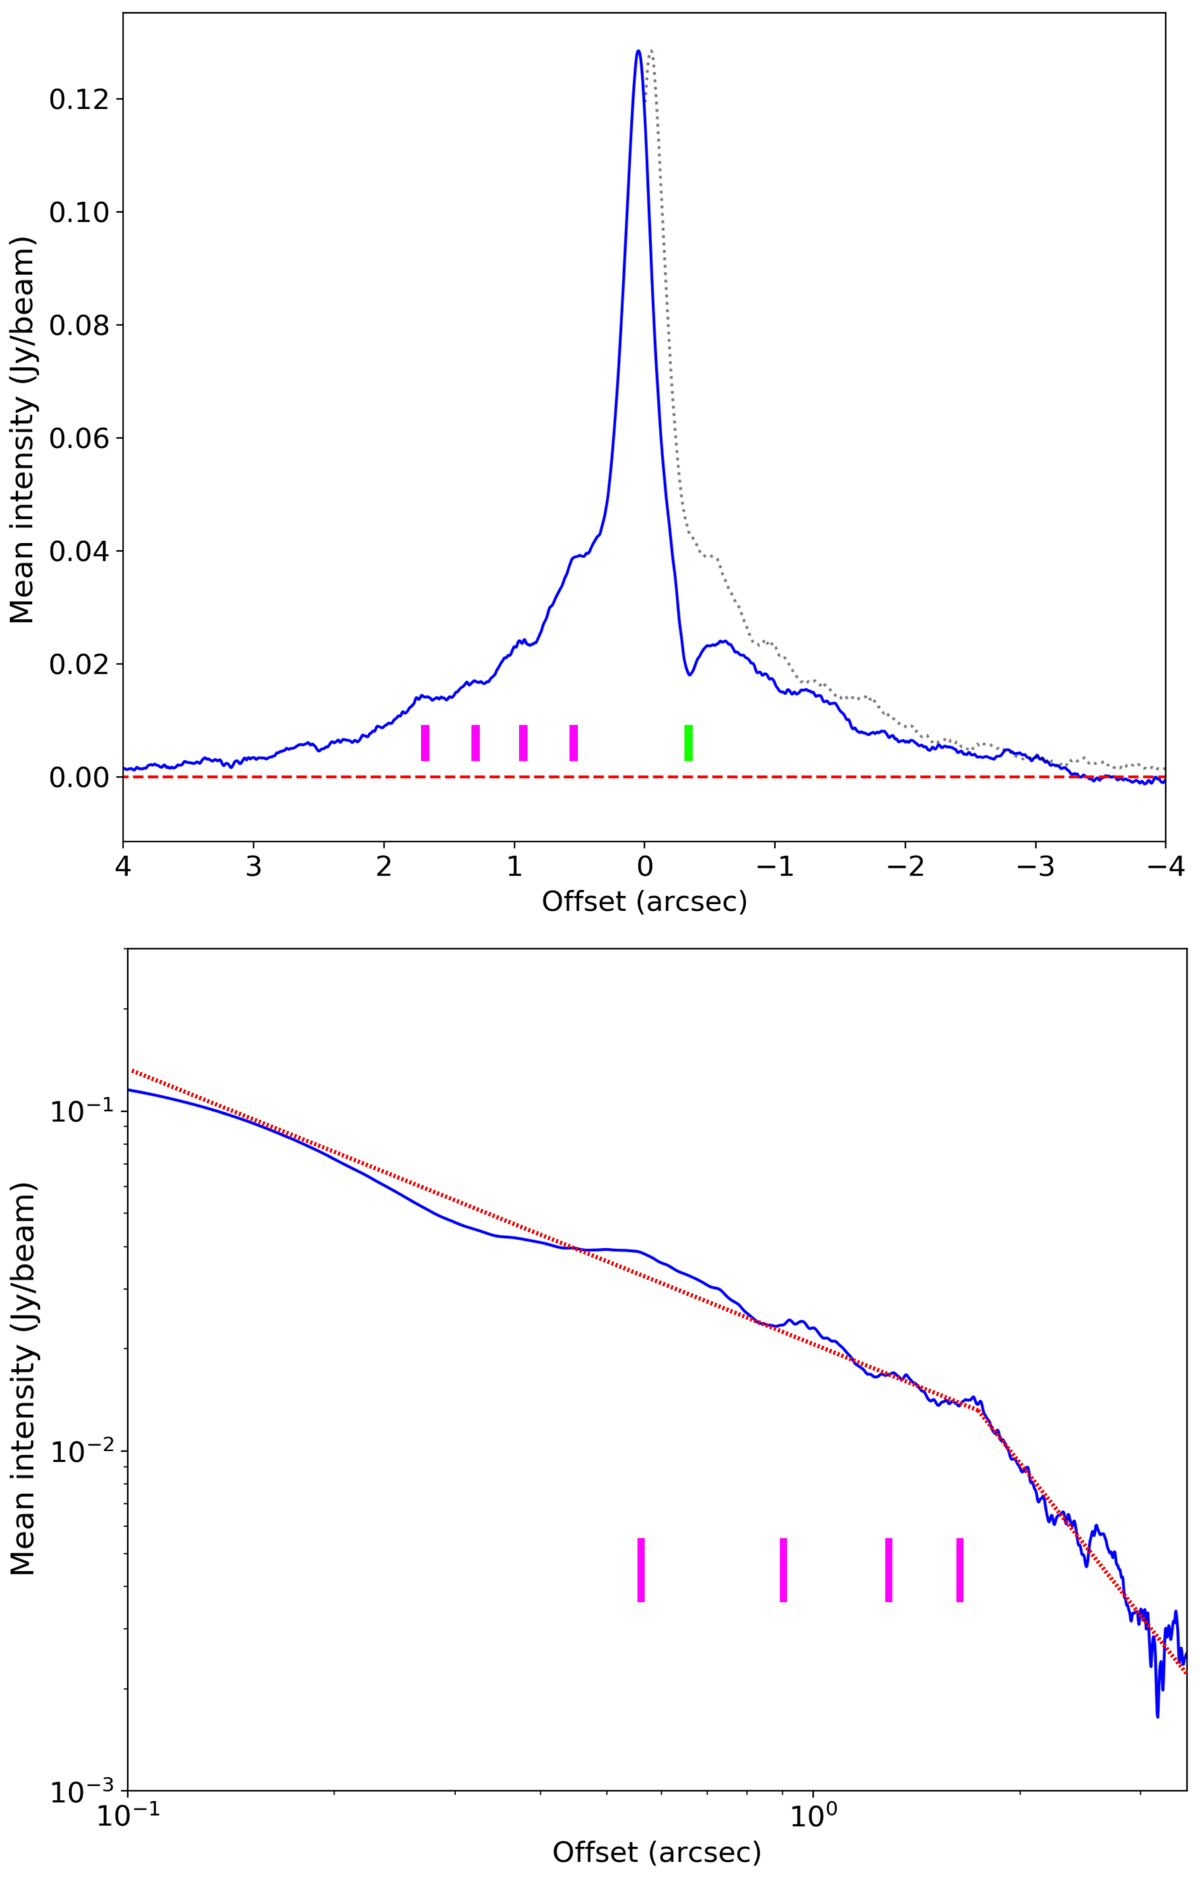
Top: SiO emission profile of the central channel, extracted from east to west through the center. The intensity axis has units of Jy beam−1. The eastern (left) profile is overplotted as a grey dashed line over the western (right) profiles to highlight the asymmetry. The SiO void is highlighted by the green tag. The purple tags indicate the locations of the equidistant bumps in the inner portion of the SiO profile. Bottom: eastern profile in log-scale. The overplotted red dotted line exhibits a shift in regime between a slope of −0.77 for the inner 1.8″, and −2.6 for the outer part.
Current usage metrics show cumulative count of Article Views (full-text article views including HTML views, PDF and ePub downloads, according to the available data) and Abstracts Views on Vision4Press platform.
Data correspond to usage on the plateform after 2015. The current usage metrics is available 48-96 hours after online publication and is updated daily on week days.
Initial download of the metrics may take a while.