Fig. 7.
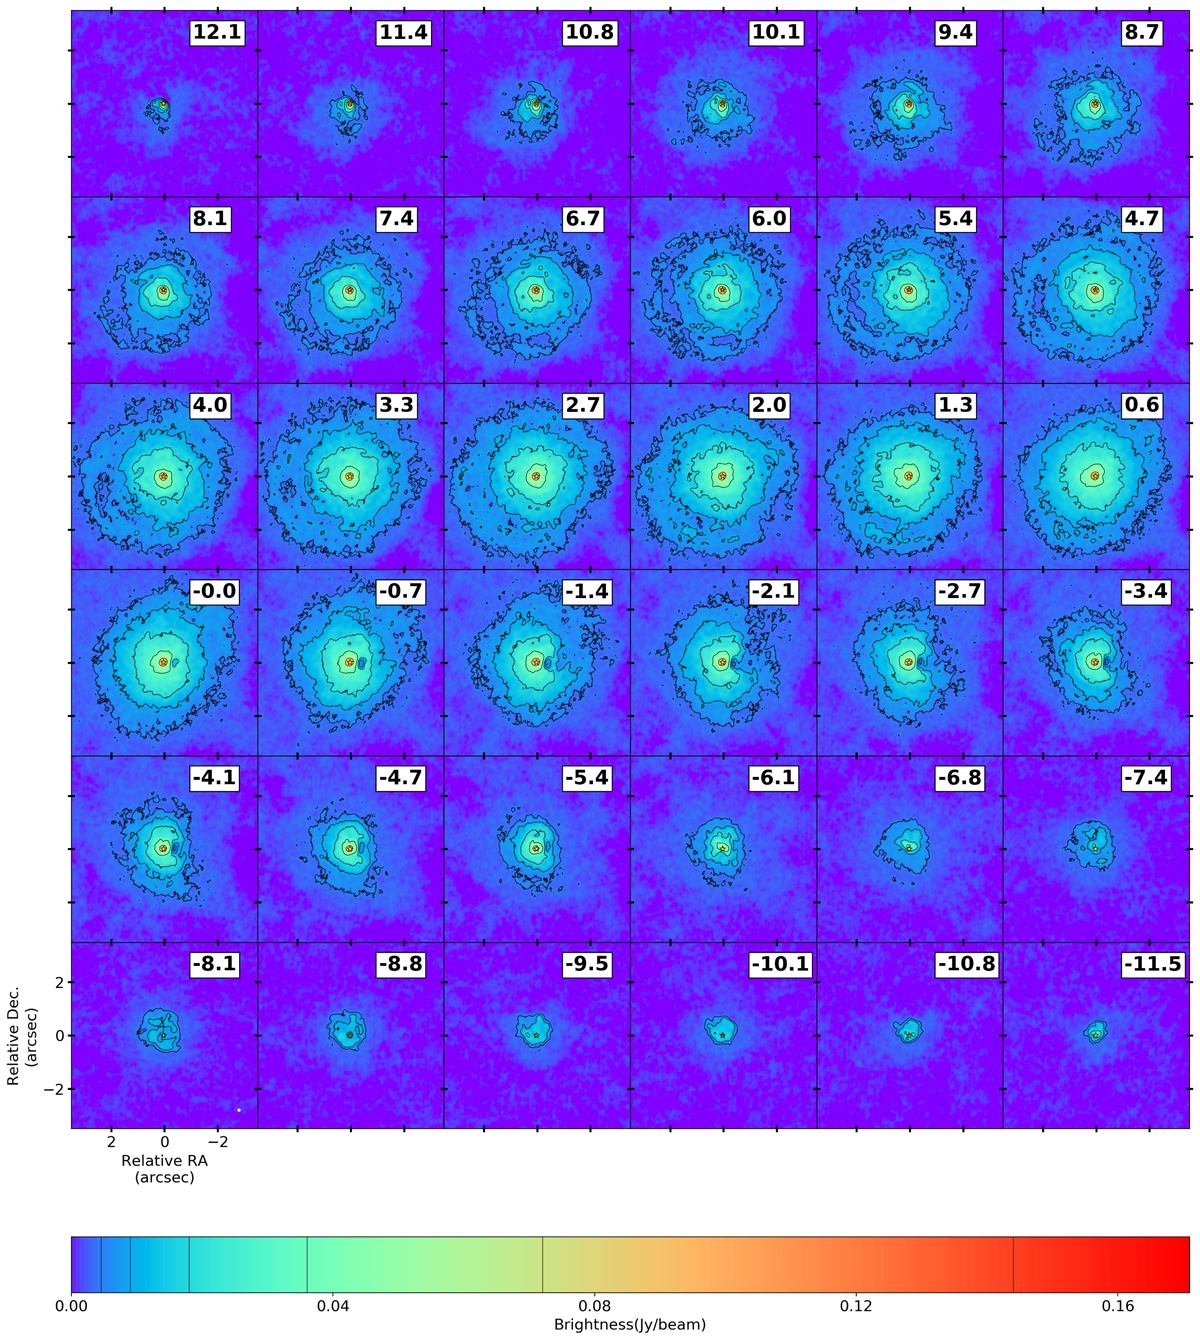
Continuum-subtracted channel maps of the SiO emission. The labelled velocities have been corrected for v*. The central observed frequency is the average over the observation epochs. The contours are drawn at 3, 6, 12, 24, 48, and 96 times the rms noise value outside the line (σrms = 1.5 × 10⁻³ Jy beam−1). Length scales are indicated in the bottom left panel. The maps are centred on the continuum peak position, which is indicated by the yellow star symbol. The beam size is illustrated in the bottom-right corner of the bottom-left panel (0.085″ × 0.079″).
Current usage metrics show cumulative count of Article Views (full-text article views including HTML views, PDF and ePub downloads, according to the available data) and Abstracts Views on Vision4Press platform.
Data correspond to usage on the plateform after 2015. The current usage metrics is available 48-96 hours after online publication and is updated daily on week days.
Initial download of the metrics may take a while.