Fig. 6.
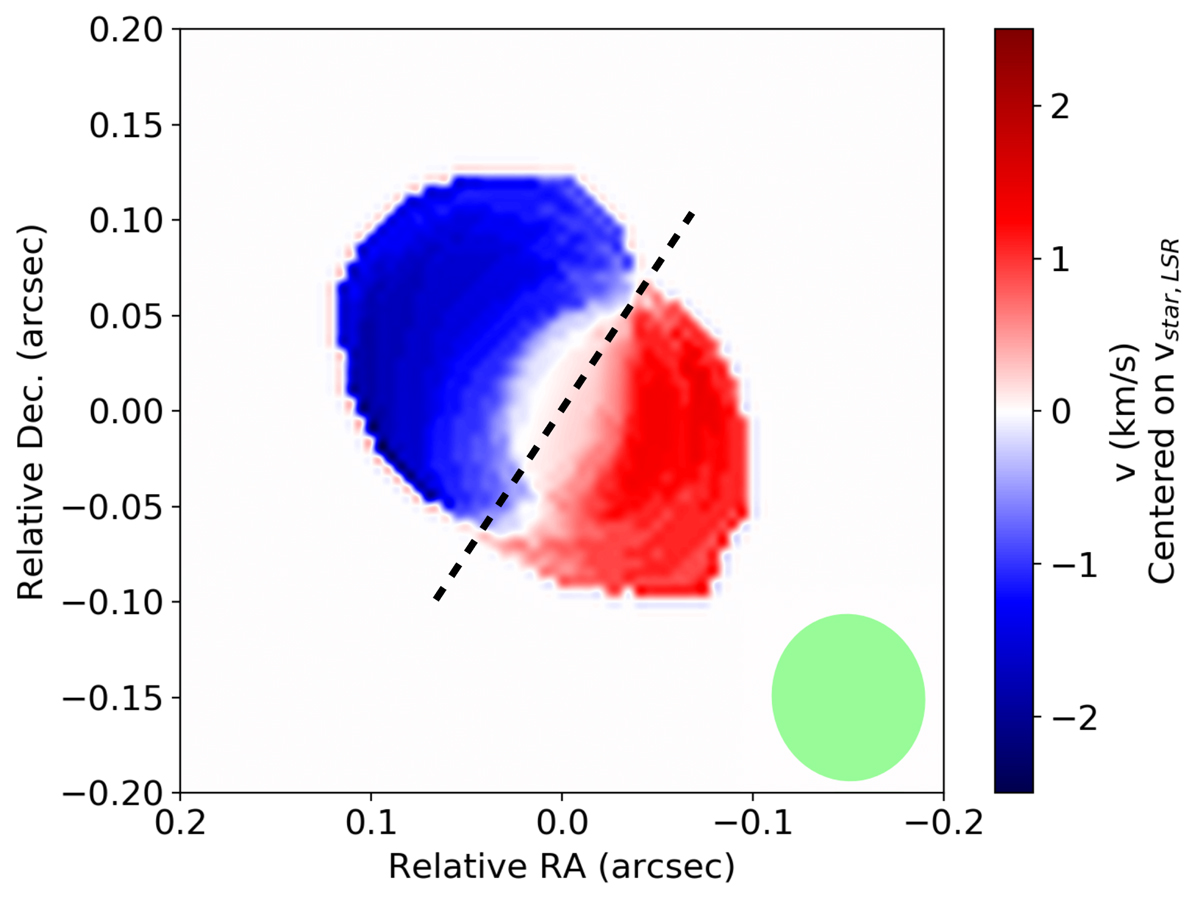
Moment 1 map of the inner CO emission for the −3 km s−1 to 3 km s−1 velocity range, and centred on the continuum brightness peak position. Only the signal above 24 times the noise rms is shown. The beam is shown in green in the bottom right corner. The black dashed line shows the approximate orientation of the rotation axis, with a PA of 145°.
Current usage metrics show cumulative count of Article Views (full-text article views including HTML views, PDF and ePub downloads, according to the available data) and Abstracts Views on Vision4Press platform.
Data correspond to usage on the plateform after 2015. The current usage metrics is available 48-96 hours after online publication and is updated daily on week days.
Initial download of the metrics may take a while.