Fig. 13.
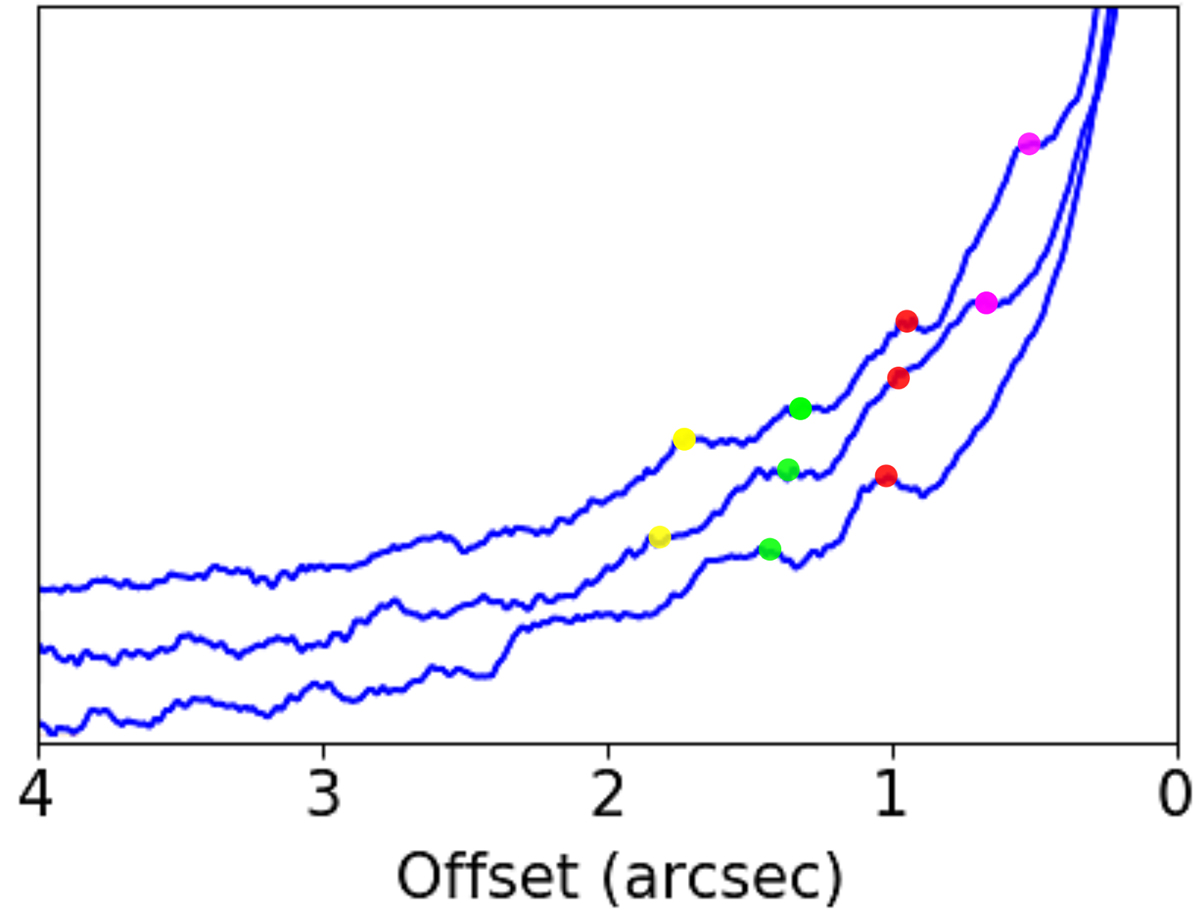
Stacked plot of three different SiO emission profiles taken at different PAs (north to east), vertically shifted by an arbitrary factor to highlight the progression of the bumps. The top profile represents the eastern wing of the profile shown in Fig. 8. The middle profile is taken at a PA of 45°, and the bottom profile at a PA of 90°. The dots highlight the bumps to show their outwards shift.
Current usage metrics show cumulative count of Article Views (full-text article views including HTML views, PDF and ePub downloads, according to the available data) and Abstracts Views on Vision4Press platform.
Data correspond to usage on the plateform after 2015. The current usage metrics is available 48-96 hours after online publication and is updated daily on week days.
Initial download of the metrics may take a while.