Free Access
Fig. 12.
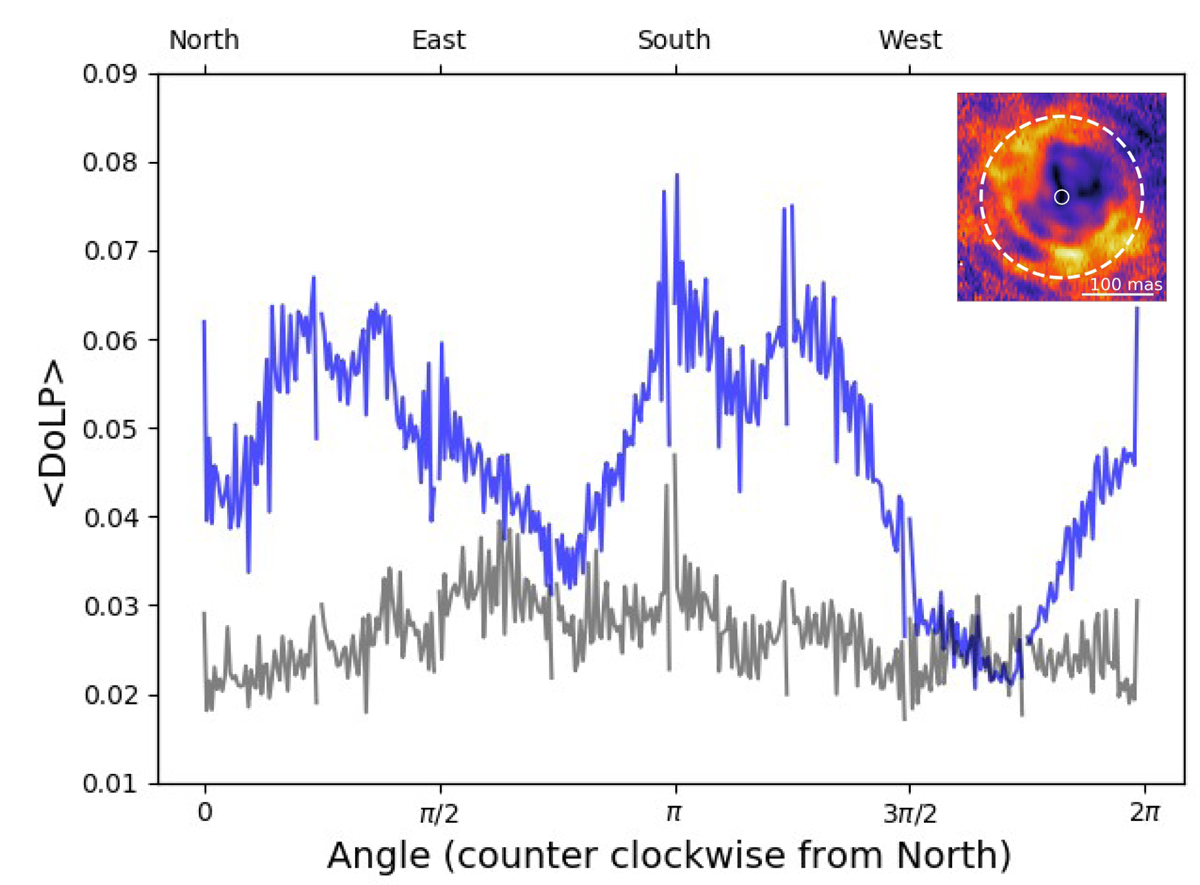
Radially averaged DoLP as a function of angle, shown in blue. The 2σrms noise level is shown in grey. The dashed line in the DoLP image in the top right corner is a visual representation of the outer radius beyond which the DoLP does not contribute to the profile.
Current usage metrics show cumulative count of Article Views (full-text article views including HTML views, PDF and ePub downloads, according to the available data) and Abstracts Views on Vision4Press platform.
Data correspond to usage on the plateform after 2015. The current usage metrics is available 48-96 hours after online publication and is updated daily on week days.
Initial download of the metrics may take a while.