Fig. 11.
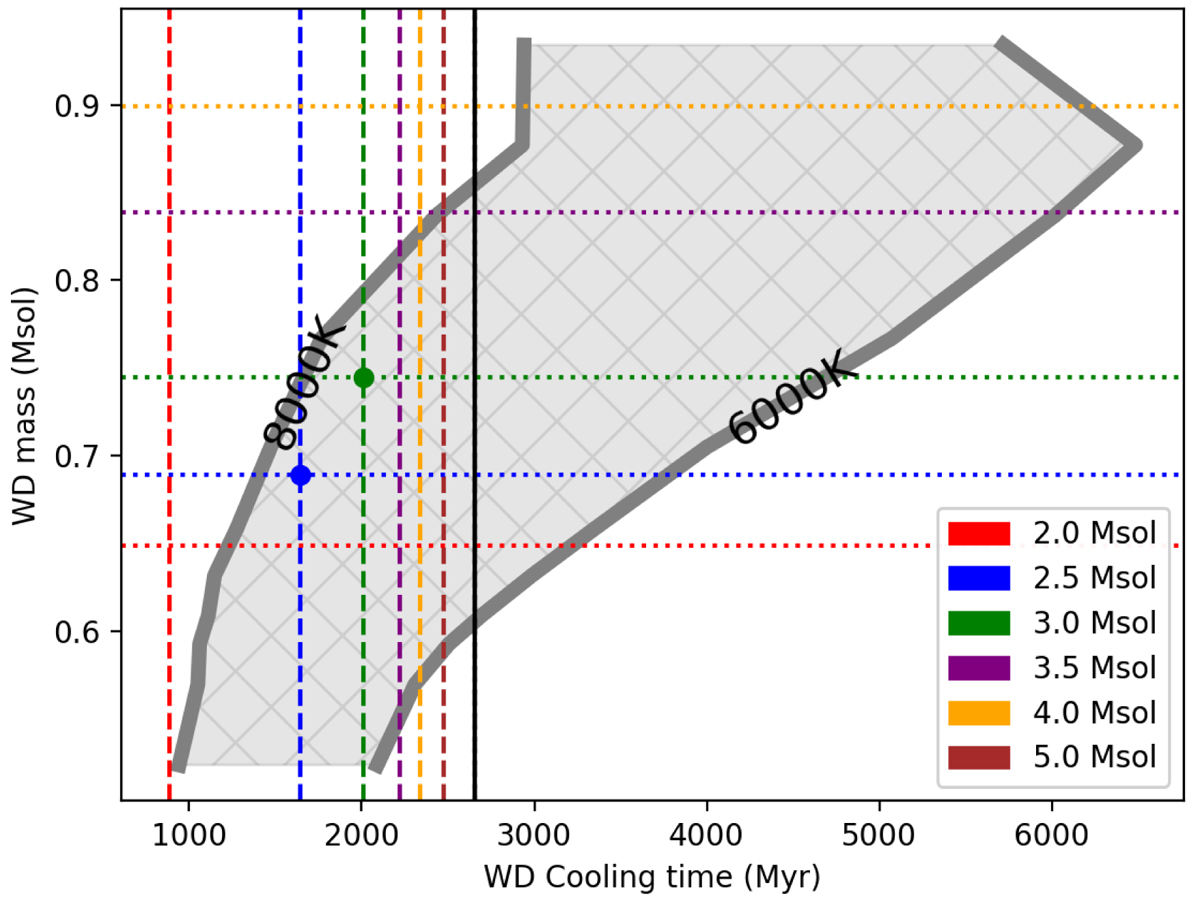
WD mass as a function of WD cooling time. The hatched region between the two broad grey curves represents the range of WD temperatures as derived from Fig. 10. The black vertical line is the main sequence lifetime of a 1.7 M⊙ star, and therefore the WD cooling time upper limit. The zone to the left of the vertical dashed lines are the maximal cooling times for WD’s with respective colour-coded progenitor masses. The horizontal dotted lines represent the WD inital-final-mass relation for the respective colour-coded progenitor masses (5.0 M⊙ is outside of the y-range of the plot). The blue and green dot represent WD masses that would have had enough time to cool to reach a temperature between 6000 K and 8000 K.
Current usage metrics show cumulative count of Article Views (full-text article views including HTML views, PDF and ePub downloads, according to the available data) and Abstracts Views on Vision4Press platform.
Data correspond to usage on the plateform after 2015. The current usage metrics is available 48-96 hours after online publication and is updated daily on week days.
Initial download of the metrics may take a while.