Open Access
Fig. 10.
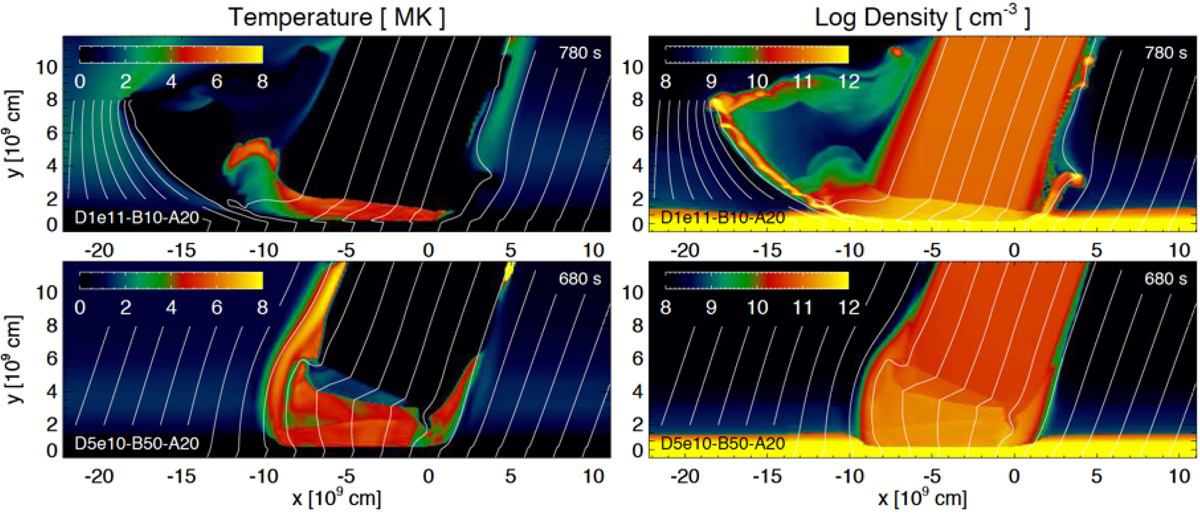
Spatial distributions of temperature (left panels) and density (right panels in log scale) at the labeled times for a model with high plasma β (run D1e11-B10-A20; upper panels) and a model with low plasma β (run D5e10-B50-A20; lower panels). The white lines mark magnetic field lines. Movie available online.
Current usage metrics show cumulative count of Article Views (full-text article views including HTML views, PDF and ePub downloads, according to the available data) and Abstracts Views on Vision4Press platform.
Data correspond to usage on the plateform after 2015. The current usage metrics is available 48-96 hours after online publication and is updated daily on week days.
Initial download of the metrics may take a while.