Fig. 3.
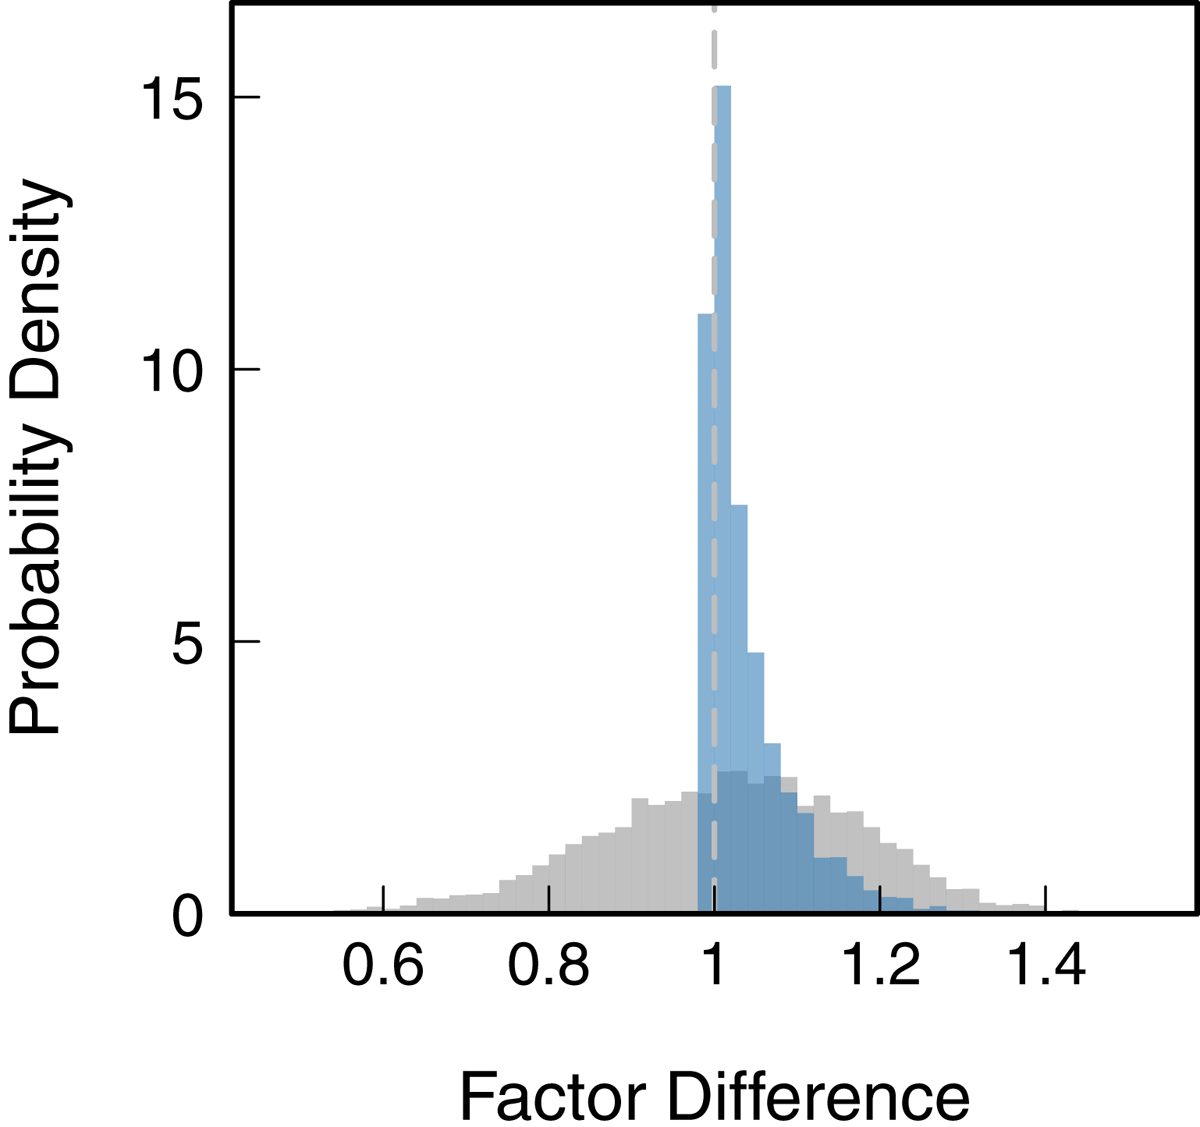
Reaction rate probability distributions from the Monte Carlo variation of resonance energies at 0.13 GK. Shown in grey is the uncorrelated case, in which the resonance energies are allowed to vary independently. In blue is the case in which the resonance energies are fully correlated. The distribution becomes narrower and highly skewed in this case owing to the effect illustrated in Fig. 2.
Current usage metrics show cumulative count of Article Views (full-text article views including HTML views, PDF and ePub downloads, according to the available data) and Abstracts Views on Vision4Press platform.
Data correspond to usage on the plateform after 2015. The current usage metrics is available 48-96 hours after online publication and is updated daily on week days.
Initial download of the metrics may take a while.